Leaflet.PolylineMeasure
- Leaflet Plugin to measure distances of simple lines as well as of complex polylines.
- Measuring in metric system (metre, kilometre), in imperial system (foot, landmile), or in nautical miles.
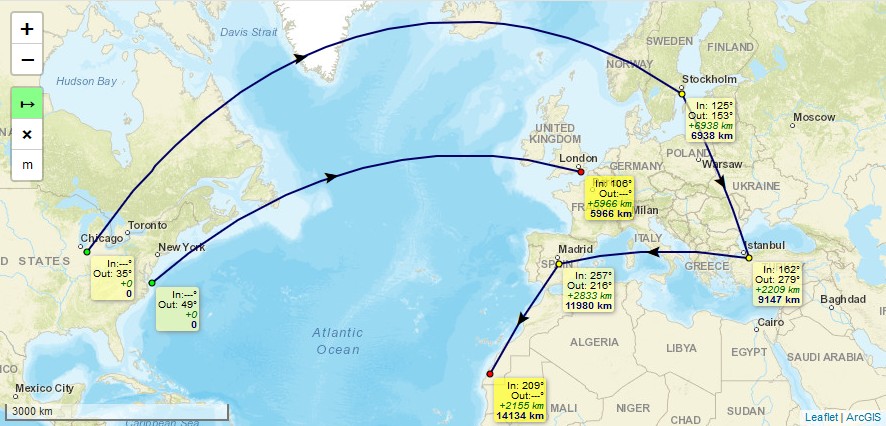
- Lines are drawn as realistic arcs. Bearings and distances are calculated considering Great-circle distance which is the shortest path between 2 points on Earth.
- Arrows indicating the real midways of the line's great-circle distances, not their optical middle which is different due to projection, especially in high latitudes.
- To finish drawing a line just doubleclick, or singleclick onto the last (=orange) point, or press "ESC"-key.
- Moving of line's points afterwards is possible by clicking and draging them. (This feature can not be guaranteed to work on every mobile browser using touch input, e.g. with Chrome Mobile it isn't working right now)
- To continue a line after it has been finished, hold the Ctrl-Key while clicking onto the first or last point of a line.
- To add points, hold the Ctrl-Key while clicking onto an arrow.
- To delete points, hold the Shift-Key while clicking onto a point.
- It is an evolution of jtreml's Plugin leaflet.measure since the original plugin hasn't been bugfixed for years. I modified it to work again with Leaflet v1.0 and newer (still runs with Leaflet v0.7) and added functional and optical improvements.
Demos
- Please take a look at these demos:
- Demo 1 (metre units, bearings, with Clear-button and Units-button)
- Demo 2 (landmile units, without bearings, without Unit-button)
- Demo 3 (nauticalmile units, bearings, without Unit-button and Clear-button)
- Demo 4 (two maps)
- Demo 5 (programatically providing polyline points)
Usage
Add 2 code lines within your HTML-file to load the .css and .js files of the plugin:
<link rel="stylesheet" href="https://ppete2.github.io/Leaflet.PolylineMeasure/Leaflet.PolylineMeasure.css" />
<script src="https://ppete2.github.io/Leaflet.PolylineMeasure/Leaflet.PolylineMeasure.js"></script>
Add 1 code line within your Javascript-file to add the plugin's control into your Leaflet map.
L.control.polylineMeasure(options).addTo(map);
Package manager install
It's possible to install and update this plugin using package managers like npm. These optional feature got added by other users. I'm not familiar with nor responsible to keep these optional package manager installs up-to-date. If you notice that such installs are outdated, feel free to provide a Pull request or contact one of the persons who once introduced those install variants, thanks.
Default options
options = {
position: 'topleft',
unit: 'metres',
clearMeasurementsOnStop: true,
showBearings: false,
bearingTextIn: 'In'
bearingTextOut: 'Out',
tooltipTextFinish: 'Click to <b>finish line</b><br>',
tooltipTextDelete: 'Press SHIFT-key and click to <b>delete point</b>',
tooltipTextMove: 'Click and drag to <b>move point</b><br>',
tooltipTextResume: '<br>Press CTRL-key and click to <b>resume line</b>',
tooltipTextAdd: 'Press CTRL-key and click to <b>add point</b>',
measureControlTitleOn: 'Turn on PolylineMeasure',
measureControlTitleOff: 'Turn off PolylineMeasure',
measureControlLabel: '↦',
measureControlClasses: [],
showClearControl: false,
clearControlTitle: 'Clear Measurements',
clearControlLabel: '×',
clearControlClasses: [],
showUnitControl: false,
distanceShowSameUnit: false,
unitControlTitle: {
text: 'Change Units',
metres: 'metres',
landmiles: 'land miles',
nauticalmiles: 'nautical miles'
},
unitControlLabel: {
metres: 'm',
kilometres: 'km',
feet: 'ft',
landmiles: 'mi',
nauticalmiles: 'nm'
},
tempLine: {
color: '#00f',
weight: 2
},
fixedLine: {
color: '#006',
weight: 2
},
startCircle: {
color: '#000',
weight: 1,
fillColor: '#0f0',
fillOpacity: 1,
radius: 3
},
intermedCircle: {
color: '#000',
weight: 1,
fillColor: '#ff0',
fillOpacity: 1,
radius: 3
},
currentCircle: {
color: '#000',
weight: 1,
fillColor: '#f0f',
fillOpacity: 1,
radius: 3
},
endCircle: {
color: '#000',
weight: 1,
fillColor: '#f00',
fillOpacity: 1,
radius: 3
},
};
Events
It fire some events during the measure in order to allow more interactivity with the app.
Subscribe to events with :
map.on('polylinemeasure:toogle', e => { });
map.on('polylinemeasure:start', currentLine => {...});
map.on('polylinemeasure:resume', currentLine => {...});
map.on('polylinemeasure:finish', currentLine => {...});
map.on('polylinemeasure:change', currentLine => {...});
map.on('polylinemeasure:clear', e => {...});
map.on('polylinemeasure:add', e => { });
map.on('polylinemeasure:insert', e => { });
map.on('polylinemeasure:move', e => { });
map.on('polylinemeasure:remove', e => { });
Seeding Data
You can programatically draw measured polylines using the .seed method. It takes an array of arrays of L.LatLng, which enables drawing multiple, discontinuous polylines:
let polylineMeasure = L.control.polylineMeasure(options);
polylineMeasure.addTo (map);

const line1coords = [
    { lat: 22.156883186860703, lng: -158.95019531250003 },
    { lat: 22.01436065310322, lng: -157.33520507812503 },
    { lat: 21.391704731036587, lng: -156.17065429687503 },
    { lat: 20.64306554672647, lng: -155.56640625000003 }
];
const line2coords = [
    { lat: 19.880391767822505, lng: -159.67529296875003 },
    { lat: 17.90556881196468, lng: -156.39038085937503 }
];

polylineMeasure.seed([line1coords, line2coords])
- Please take a look at Demo 5, where multiple polylines are drawn and measured programatically.


