
Research
Malicious fezbox npm Package Steals Browser Passwords from Cookies via Innovative QR Code Steganographic Technique
A malicious package uses a QR code as steganography in an innovative technique.
By Olivia Brown - Sep 22, 2025
Create beautiful, interactive maps with one line of JavaScript
For charts, check out Chartkick.js
![]()
Mapkick supports Mapbox and MapLibre.
First, create a Mapbox account to get an access token.
Download mapkick.js and add in the <head> of your HTML file:
<link href="https://api.mapbox.com/mapbox-gl-js/v2.12.0/mapbox-gl.css" rel="stylesheet" />
<script src="https://api.mapbox.com/mapbox-gl-js/v2.12.0/mapbox-gl.js"></script>
<script src="mapkick.js"></script>
<script>
  mapboxgl.accessToken = "YOUR-TOKEN"
</script>
Download mapkick.js and add in the <head> of your HTML file:
<link href="https://unpkg.com/maplibre-gl@2.4.0/dist/maplibre-gl.css" rel="stylesheet" />
<script src="https://unpkg.com/maplibre-gl@2.4.0/dist/maplibre-gl.js"></script>
<script src="mapkick.js"></script>
<script>
  Mapkick.options = {style: "https://demotiles.maplibre.org/style.json"}
</script>
Create a map
<div id="map" style="height: 400px;"></div>

<script>
  new Mapkick.Map("map", [{latitude: 37.7829, longitude: -122.4190}])
</script>
Point map
new Mapkick.Map("map", [{latitude: 37.7829, longitude: -122.4190}])
Area map
new Mapkick.AreaMap("map", [{geometry: {type: "Polygon", coordinates: ...}}])
Data can be an array
new Mapkick.Map("map", [{latitude: 37.7829, longitude: -122.4190}])
Or a URL that returns JSON (same format as above)
new Mapkick.Map("map", "/restaurants")
Or a callback
function fetchData(success, fail) {
  success([{latitude: 37.7829, longitude: -122.4190}])
  // or fail("Data not available")
}

new Mapkick.Map("map", fetchData)
Use latitude or lat for latitude and longitude, lon, or lng for longitude
You can specify an icon, label, tooltip, and color for each data point
{
  latitude: ...,
  longitude: ...,
  icon: "restaurant",
  label: "Hot Chicken Takeover",
  tooltip: "5 stars",
  color: "#f84d4d"
}
Maki icons are supported (depending on the map style, only some icons may be available)
Use geometry with a GeoJSON Polygon or MultiPolygon
You can specify a label, tooltip, and color for each data point
{
  geometry: {type: "Polygon", coordinates: ...},
  label: "Hot Chicken Takeover",
  tooltip: "5 stars",
  color: "#0090ff"
}
Marker color
new Mapkick.Map("map", data, {markers: {color: "#f84d4d"}}
Show tooltips on click instead of hover
new Mapkick.Map("map", data, {tooltips: {hover: false}})
Allow HTML in tooltips (must sanitize manually)
new Mapkick.Map("map", data, {tooltips: {html: true}})
Map style
new Mapkick.Map("map", data, {style: "mapbox://styles/mapbox/outdoors-v12"})
Zoom and controls
new Mapkick.Map("map", data, {zoom: 15, controls: true})
Pass options directly to the mapping library
new Mapkick.Map("map", data, {library: {hash: true}})
See the documentation for Mapbox GL JS and MapLibre GL JS for more info
To set options for all of your maps, use:
Mapkick.options = {
  style: "mapbox://styles/mapbox/outdoors-v12"
}
Refresh data periodically from a remote source to create a live map
new Mapkick.Map("map", url, {refresh: 10}) // seconds
Show trails
new Mapkick.Map("map", url, {trail: true, refresh: 10})
Use the id attribute to identify objects
[
  {id: "bus-1", lat: ..., lon: ...},
  {id: "bus-2", lat: ..., lon: ...}
]
Set trail length
new Mapkick.Map("map", url, {trail: {len: 10}, refresh: 10})
new Mapkick.Map("map", data, {replay: true})
Use the id attribute to identify objects and the time attribute for when the data was measured
[
  {id: "bus-1", lat: ..., lon: ..., time: t0},
  {id: "bus-2", lat: ..., lon: ..., time: t0},
  {id: "bus-1", lat: ..., lon: ..., time: t1},
  {id: "bus-2", lat: ..., lon: ..., time: t1}
]
Times can be a Date, a timestamp (or sequence number), or a string (strings are parsed)
View the changelog
Everyone is encouraged to help improve this project. Here are a few ways you can help:
To get started with development:
git clone https://github.com/ankane/mapkick.js.git
cd mapkick.js
npm install
npm run build-dev
0.2.6 (2023-07-24)
library optionFAQs
Create beautiful, interactive maps with one line of JavaScript
The npm package mapkick receives a total of 643 weekly downloads. As such, mapkick popularity was classified as not popular.
We found that mapkick demonstrated a not healthy version release cadence and project activity because the last version was released a year ago. It has 1 open source maintainer collaborating on the project.
Did you know?

Socket for GitHub automatically highlights issues in each pull request and monitors the health of all your open source dependencies. Discover the contents of your packages and block harmful activity before you install or update your dependencies.
Research
A malicious package uses a QR code as steganography in an innovative technique.

Research
/Security News
Socket identified 80 fake candidates targeting engineering roles, including suspected North Korean operators, exposing the new reality of hiring as a security function.
Application Security
/Research
/Security News
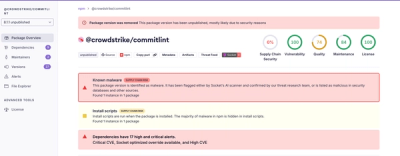
Socket detected multiple compromised CrowdStrike npm packages, continuing the "Shai-Hulud" supply chain attack that has now impacted nearly 500 packages.