MemScope
Real-time memory profiler for backend & frontend applications
MemScope helps developers visualize, understand, and debug memory usage in their projects with zero setup and a live dashboard.
It works locally, runs entirely on your machine, and supports:
- Backend (Node.js)
- Frontend (Browser JS heap – Chromium-based)
- Full‑stack apps (backend + frontend together)
Why MemScope?
Memory bugs are hard:
- Silent leaks
- Unpredictable spikes
- Heap snapshots that are painful to interpret
- No unified view for backend + frontend
MemScope fixes that by giving you:
- Live memory graphs
- Clear spikes & GC behavior
- Backend + frontend separation
- One-command usage
- No cloud, no accounts, no config
Installation & Usage
Option 1: One-time run (recommended)
npx memscope run node app.js
Option 2: Install globally
npm install -g memscope
memscope run node app.js
This automatically:
- Starts the MemScope collector
- Injects the memory agent
- Opens a live dashboard
- Streams memory data in real time
Tracking Modes
Backend only (default)
memscope run node app.js
Tracks:
- Node.js heap
- RSS / external memory
- GC behavior
Frontend only (browser)
memscope run --frontend
Then inject the browser agent in development only.
React / Vite
if (import.meta.env.DEV) {
  import("memscope/agent/browser");
}
CRA / Webpack
if (process.env.NODE_ENV === "development") {
  require("memscope/agent/browser");
}
⚠️ Frontend tracking works best in Chrome / Edge.
Safari does not expose JavaScript heap APIs.
Full‑stack (backend + frontend)
memscope run --both npm run dev
This gives you two live graphs:
- Backend memory
- Frontend browser memory
Perfect for:
- SSR leaks
- API + UI interactions
- Long‑running sessions
Dashboard
Once running, open:
http://localhost:3333/dashboard/index.html
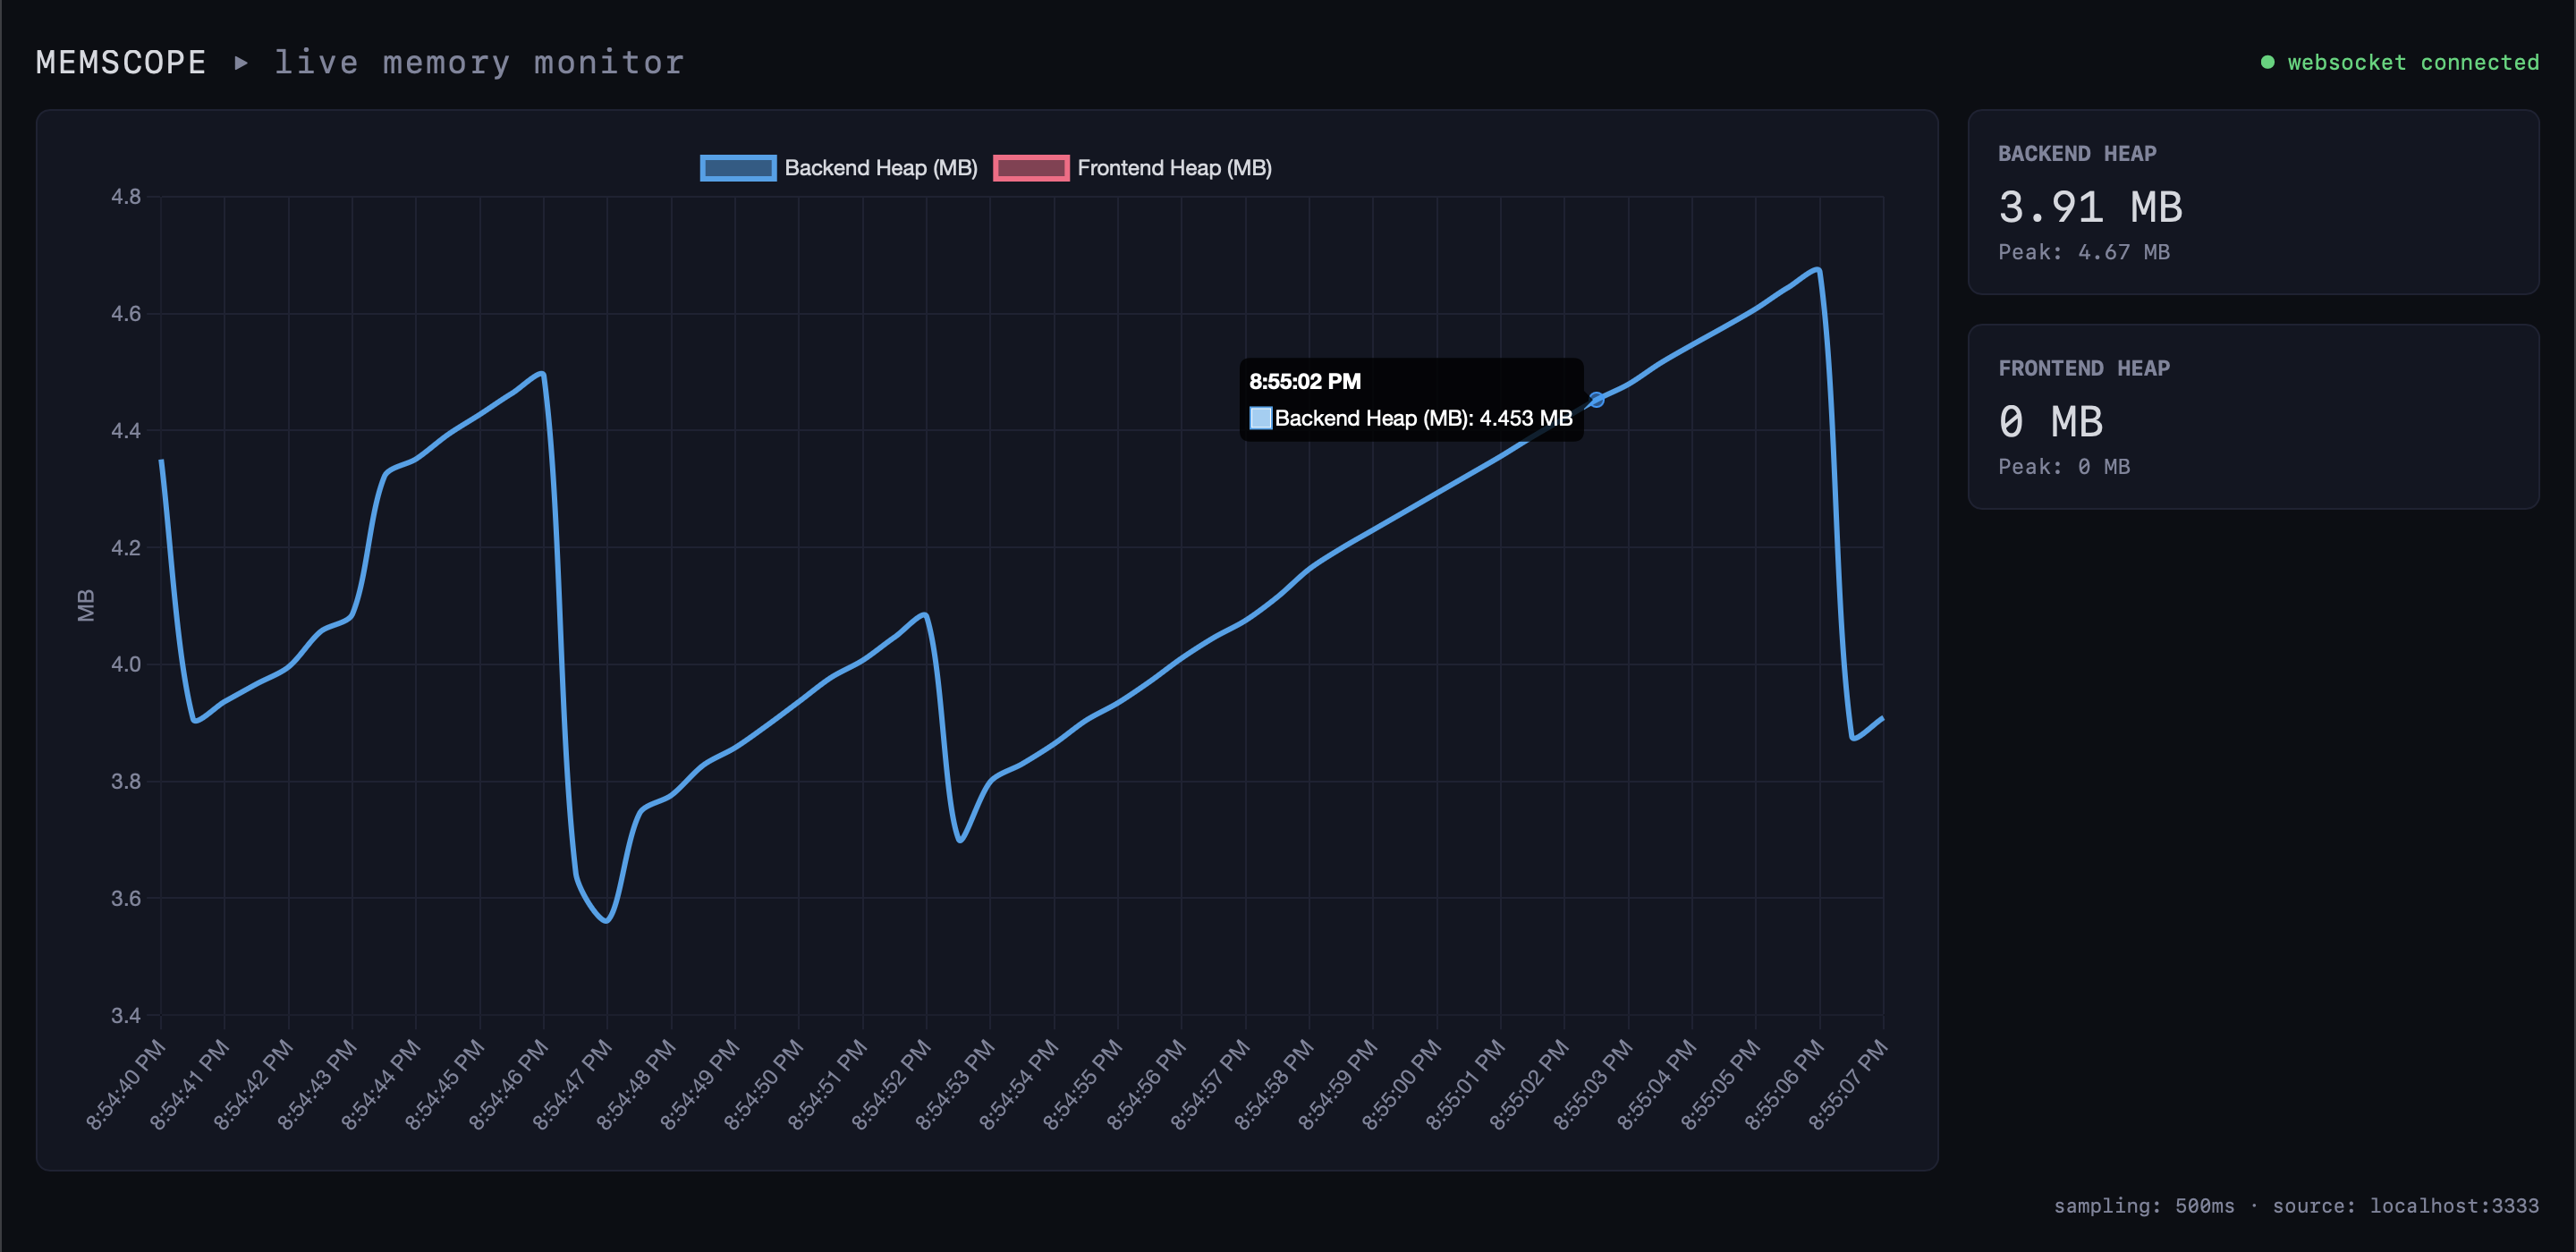
You’ll see:
- Live memory timeline
- Backend vs frontend separation
- GC dips & spikes
- Clear growth patterns
Example Use Cases
Debug a memory leak
memscope run node worker.js
Compare before/after refactor
memscope run node app.js
memscope run node app.js
SPA navigation leak
memscope run --frontend
npm run dev
How MemScope Works (Internals)
CLI
 ├─ starts collector (local)
 ├─ injects memory agent
 ├─ runs your app
 │
 ├─ agent samples memory
 ├─ collector aggregates data
 ├─ WebSocket streams live points
 └─ dashboard renders graphs
Everything runs locally.
Privacy & Security
- No cloud
- No uploads
- No tracking
- No external services
MemScope never sends your data anywhere.
Current Limitations
- Frontend heap tracking requires Chromium
- Port 3333 must be free
- Node.js >= 16
Roadmap
- Heap / RSS / External toggles
- Memory spike annotations
- Session comparison
- Leak heuristics
- Python & JVM agents
Author
Built with ❤️ for developers who care about performance.
Contributions welcome.


