Product
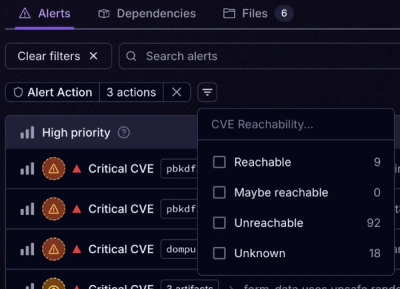
Introducing Tier 1 Reachability: Precision CVE Triage for Enterprise Teams
Socket’s new Tier 1 Reachability filters out up to 80% of irrelevant CVEs, so security teams can focus on the vulnerabilities that matter.
nodeplotlib
Advanced tools
 NodePlotLib
Library to create plots directly in TypeScript or JavaScript in NodeJS on top of plotly.js without any front-end preparations. Inspired by matplotlib.
npm install nodeplotlib
# or
yarn add nodeplotlib
Use with TypeScript/JavaScript:
import { plot, Plot } from 'nodeplotlib';

const data: Plot[] = [
  {
    x: [1, 3, 4, 5],
    y: [3, 12, 1, 4],
    type: 'scatter',
  },
];

plot(data);
NodePlotLib makes use of the popular RxJS library, which provides functionality for streams, stream creator functions (e.g. from interval or from event), and tons of operators to modify your stream.
In this example we create a stream based on an interval which triggers every 100ms. Then we modify
the output of the interval (which is just a counter) to be an actual Plot using RxJS' map operator.
The output will be a sin function.
import { plot, Plot } from 'nodeplotlib';
import { interval, map } from 'rxjs';

const stream$: Observable<Plot[]> = interval(100).pipe(
  map(createSinusPlotFromNumber)
);

function createSinusPlotFromNumber(num: number): Plot[] {
  const data: Plot[] = [
    {
      x: [0, 1, 2, 3, 4, 5, 6, 7, 8, 9],
      y: Array(10)
        .fill(0)
        .map((_, i) => Math.sin(num + i)),
      type: 'scatter',
    },
  ];
  return data;
}
As you can see, providing a function for a dynamic plot seems to be a good idea. The functions content looks almost the same as the "non-stream" version. Simple as that, you can just put the created Observable as an argument in the plot function:
plot(stream$);
There are three exports. The plot function and types for the Plot and for the Layout.
import { plot, Plot, Layout, Config } from 'nodeplotlib';
The plot function has the following structure
function plot(
  data: Plot[] | Observable<Plot[]>,
  layout?: Layout,
  config?: Config
): void;
It does not return a Subscription for the Observables because you just need to close the listening browser window to unsubscribe from all Obserables.
In this section there are some examples to getting started. See the full plotly cheatsheet.
const trace1: Plot = { x: [1, 2], y: [1, 2], type: 'scatter' };
const trace2: Plot = { x: [3, 4], y: [9, 16], type: 'scatter' };
plot([trace1, trace2]);
const trace: Plot = { x: [1, 2], y: [1, 2], type: 'bar' };
plot([trace]);
const trace: Plot = {
  x: [9, 8, 5, 1],
  y: [1, 2, 4, 8],
  z: [11, 8, 15, 3],
  type: 'scatter3d',
};
plot([trace]);
const trace: Plot = {
  colorscale: 'Viridis',
  z: [
    [3, 5, 7, 9],
    [21, 13, 8, 5],
  ],
};
plot([trace]);
In order to style the plot, one is able to pass in the layout parameter, which internally
is typeof Partial<Layout> from plotly's Layout. See the full layout documentation
here.
With this parameter one is able to define styles like title, axis labels, subplots and many more.
const data: Plot[] = [
  {
    type: 'scatterpolar',
    r: [1.5, 10, 39, 31, 15, 1.5],
    theta: ['A', 'B', 'C', 'D', 'E', 'A'],
    fill: 'toself',
    name: 'Group B',
  },
];

const layout: Layout = {
  polar: {
    radialaxis: {
      visible: true,
      range: [0, 50],
    },
  },
};

plot(data, layout);
| Simple charts | Advanced charts | 3D Plots |
|---|---|---|
| Scatter | 2d density plots | Scatter |
| Line | Histograms | Surface |
| Bar | Box-plots | Lines |
| Pie charts | Contour plots | |
| Sankey diagrams | Heatmaps | |
| Tables | Radar charts |
Contributions in all forms are welcome.
You can find the developers guide in the repositories root README.md.
FAQs
NodeJS frontend-less plotting lib using plotly.js inspired by matplotlib
The npm package nodeplotlib receives a total of 2,182 weekly downloads. As such, nodeplotlib popularity was classified as popular.
We found that nodeplotlib demonstrated a not healthy version release cadence and project activity because the last version was released a year ago. It has 1 open source maintainer collaborating on the project.
Did you know?

Socket for GitHub automatically highlights issues in each pull request and monitors the health of all your open source dependencies. Discover the contents of your packages and block harmful activity before you install or update your dependencies.

Product
Socket’s new Tier 1 Reachability filters out up to 80% of irrelevant CVEs, so security teams can focus on the vulnerabilities that matter.

Research
/Security News
Ongoing npm supply chain attack spreads to DuckDB: multiple packages compromised with the same wallet-drainer malware.

Security News
The MCP Steering Committee has launched the official MCP Registry in preview, a central hub for discovering and publishing MCP servers.