Product
Introducing Socket Fix for Safe, Automated Dependency Upgrades
Automatically fix and test dependency updates with socket fix—a new CLI tool that turns CVE alerts into safe, automated upgrades.
By John-David Dalton - Apr 25, 2025
office-chart
Advanced tools
Node.js excel chart builder
Install
npm install office-chart
Generate xlsx and write chart to file
import { IData } from "office-chart";
import { XlsxGenerator } from "office-chart";

const gen = new XlsxGenerator();

await gen.createWorkbook();

const sheet1 = await gen.createWorksheet("sheet1");

const sheet2 = await gen.createWorksheet("sheetWithChart2");

const header = ["h", "b", "c", "d"];
const row1 = ["label1", 2, 3, 4];
const row2 = ["label2", 5, 6, 7];

await sheet2.addTable([header, row1, row2]);

const opt: IData = {
  title: {
    name: "testChart line",
    color: "8ab4f8",
    size: 5000,
  },
  range: "B1:D3",
  type: "line",
  rgbColors: ["8ab4f8", "ff7769"],
  labels: true, //table contains labels
  marker: {
    size: 4,
    shape: "square", //marker shapes, can be circle, diamond, star
  },
  lineWidth: 20000,
};

await sheet2.addChart(opt);

const sheet3 = await gen.createWorksheet("sheet3");

await gen.generate(__dirname + "/test", "file");
// you can also generate buffer
Generate ppt with slides and text
import { PptxGenetator } from "office-chart";
import { IPPTChartData } from "office-chart/dist/xlsx/models/data.model";

const gen = new PptxGenetator();

await gen.createPresentation();

const slide = await gen.createSlide();

slide.addTitle("this is title", {
  x: "0",
  y: "0",
  color: "FF0000",
  size: 4000,
});

slide.addSubTitle("this is subtitle");

slide.addText("this is text", {
  color: "FF0000",
});

const header = ["h", "b", "c", "d"];
const row1 = ["label1", 2, 3, 4];
const row2 = ["label2", 5, 6, 7];

await slide.addTable([header, row1, row2], {
  x: "1000", // left
  y: "1000", // top
  colWidth: 1081250,
  rowHeight: 1059279,
});

const opt: IPPTChartData = {
  title: {
    name: "testChart line",
    color: "8ab4f8",
    size: 3000,
  },
  type: "line",
  data: [header, row1, row2], // can also be:
  // [
  //       {
  //           name: 'lab1 test', //label
  //           values: [1, 2, 3, 4, 5], //yvalues
  //           labels: ['h', 'b', 'c', 'd', 'e'] //xvalue
  //       }, {
  //           name: 'lab2 test',
  //           values: [4, 5, 6, 7, 8],
  //           labels: ['h', 'b', 'c', 'd', 'e']
  //       }, {
  //           name: 'lab3 test',
  //           values: [9, 1, 2, 4, 10],
  //           labels: ['h', 'b', 'c', 'd', 'e']
  //       }
  //   ]
  rgbColors: ["8ab4f8", "ff7769"],
  lineWidth: 20000,
  marker: {
    shape: "circle",
    size: 4,
  },
  labels: true,
};

const slide2 = await gen.createSlide();

await slide2.addChart(opt);
await slide2.addTitle(null); //remove title
await slide2.addSubTitle(null); //remove subtitle

await gen.generate(__dirname + "/test2", "file");
FAQs
create office xlsx and pptx with tables and charts
The npm package office-chart receives a total of 64 weekly downloads. As such, office-chart popularity was classified as not popular.
We found that office-chart demonstrated a not healthy version release cadence and project activity because the last version was released a year ago. It has 1 open source maintainer collaborating on the project.
Did you know?

Socket for GitHub automatically highlights issues in each pull request and monitors the health of all your open source dependencies. Discover the contents of your packages and block harmful activity before you install or update your dependencies.
Product
Automatically fix and test dependency updates with socket fix—a new CLI tool that turns CVE alerts into safe, automated upgrades.

Security News
CISA denies CVE funding issues amid backlash over a new CVE foundation formed by board members, raising concerns about transparency and program governance.
Product
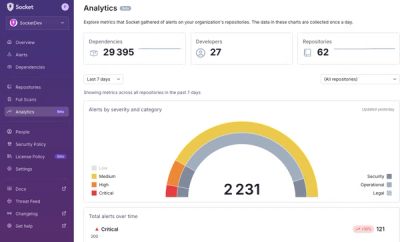
We’re excited to announce a powerful new capability in Socket: historical data and enhanced analytics.