Product
Socket for Jira Is Now Available
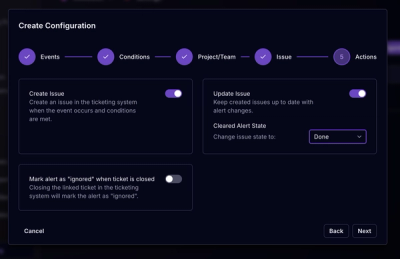
Socket for Jira lets teams turn alerts into Jira tickets with manual creation, automated ticketing rules, and two-way sync.
PMX allows you to create advanced interactions with PM2 and Keymetrics.io.
Install pmx with npm:
$ npm install pmx --save
PMX allows you to expose code metrics from your code to the PM2 monit command or the Keymetrics Dashboard, in realtime and over time.
4 measurements are available:
This allow to expose values that can be read instantly.
var probe = pmx.probe();

// Here the value function will be called each second to get the value
// returned by Object.keys(users).length
var metric = probe.metric({
  name    : 'Realtime user',
  value   : function() {
    return Object.keys(users).length;
  }
});

// Here we are going to call valvar.set() to set the new value
var metric_2 = probe.metric({
  name    : 'Realtime Value'
});

metric_2.set(23);
Things that increment or decrement.
var probe = pmx.probe();

// The counter will start at 0
var counter = probe.counter({
  name : 'Current req processed'
});

http.createServer(function(req, res) {
  // Increment the counter, counter will eq 1
  counter.inc();
  req.on('end', function() {
    // Decrement the counter, counter will eq 0
    counter.dec();
  });
});
Things that are measured as events / interval.
var probe = pmx.probe();

var meter = probe.meter({
  name      : 'req/sec',
  samples   : 1  // This is per second. To get per min set this value to 60
});

http.createServer(function(req, res) {
  meter.mark();
  res.end({success:true});
});
Keeps a resevoir of statistically relevant values biased towards the last 5 minutes to explore their distribution.
var probe = pmx.probe();

var histogram = probe.histogram({
  name        : 'latency',
  measurement : 'mean'
});

var latency = 0;

setInterval(function() {
  latency = Math.round(Math.random() * 100);
  histogram.update(latency);
}, 100);
sum, max, min, avg (default) or none. It will impact the way the probe data are aggregated within the Keymetrics backend. Use none if this is irrelevant (eg: constant or string value).Meter and Counter probes. Creates an alert object (see below).Remotely trigger functions from Keymetrics. These metrics takes place in the main Keymetrics Dashboard page under the Custom Action section.
Simple action allows to trigger a function from Keymetrics. The function takes a function as a parameter (reply here) and need to be called once the job is finished.
Example:
var pmx = require('pmx');

pmx.action('db:clean', function(reply) {
  clean.db(function() {
    /**
     * reply() must be called at the end of the action
     */
     reply({success : true});
  });
});
Scoped Actions are advanced remote actions that can be also triggered from Keymetrics.
Two arguments are passed to the function, data (optional data sent from Keymetrics) and res that allows to emit log data and to end the scoped action.
Example:
pmx.scopedAction('long running lsof', function(data, res) {
  var child = spawn('lsof', []);

  child.stdout.on('data', function(chunk) {
    chunk.toString().split('\n').forEach(function(line) {
      res.send(line); // This send log to Keymetrics to be saved (for tracking)
    });
  });

  child.stdout.on('end', function(chunk) {
    res.end('end'); // This end the scoped action
  });

  child.on('error', function(e) {
    res.error(e);  // This report an error to Keymetrics
  });

});
(Specific to Keymetrics)
This alert system can monitor a Probe value and launch an exception when hitting a particular value.
Example for a cpu_usage variable:
var metric = probe.metric({
  name  : 'CPU usage',
  value : function() {
    return cpu_usage;
  },
  alert : {
    mode  : 'threshold',
    value : 95,
    msg   : 'Detected over 95% CPU usage', // optional
    func  : function() { //optional
      console.error('Detected over 95% CPU usage');
    },
    cmp   : "<" // optional
  }
});
threshold, threshold-avg.<, >, = to Threshold value the exception is launched. Can also be a function used for exception check taking 2 arguments and returning a bool.threshold-avg mode. Sample length for monitored value (180 seconds default).threshold-avg mode. Time after which mean comparison starts (30 000 milliseconds default).(Specific to Keymetrics)
By default once PM2 is linked to Keymetrics, you will be alerted of any uncaught exception. These errors are accessible in the Issue tab of Keymetrics.
If you need to alert about any critical errors you can do it programmatically:
var pmx = require('pmx');

pmx.notify({ success : false });

pmx.notify('This is an error');

pmx.notify(new Error('This is an error'));
When an uncaught exception is happening you can track from which routes it has been thrown.
To do that you have to attach the middleware pmx.expressErrorHandler at then end of your routes mounting:
var pmx = require('pmx');

// All my routes
app.get('/' ...);
app.post(...);
// All my routes

// Here I attach the middleware to get more verbosity on exception thrown
app.use(pmx.expressErrorHandler());
Emit events and get historical and statistics. This is available in the Events page of Keymetrics.
var pmx = require('pmx');

pmx.emit('user:register', {
  user : 'Alex registered',
  email : 'thorustor@gmail.com'
});
You can monitor the network usage of a specific application by adding the option network: true when initializing PMX. If you enable the flag ports: true when you init pmx it will show which ports your app is listenting on.
These metrics will be shown in the Keymetrics Dashboard in the Custom Metrics section.
Example:
pmx.init({
  [...]
  network : true, // Allow application level network monitoring
  ports   : true  // Display ports used by the application
});
var pmx = require('pmx').init({
  network       : true, // (default: false) Network monitoring at the application level
  ports         : true, // (default: false) Shows which ports your app is listening on
  // can be 'express', 'hapi', 'http', 'restify'
  excludedHooks: []
});
MIT
New Relic is a comprehensive monitoring tool that provides detailed insights into application performance, infrastructure, and user experience. It offers more extensive features compared to pmx, including distributed tracing, advanced analytics, and integration with a wide range of services.
Appmetrics is an open-source monitoring tool for Node.js applications. It provides basic monitoring capabilities such as CPU, memory, and event loop metrics. While it offers similar functionalities to pmx, it lacks the advanced features and seamless integration with PM2.
OpenTelemetry is an open-source observability framework that provides APIs and tools for collecting metrics, logs, and traces. It offers a more flexible and extensible approach compared to pmx, allowing integration with various backends and supporting multiple languages.
FAQs
PM2/Keymetrics advanced API
The npm package pmx receives a total of 118,551 weekly downloads. As such, pmx popularity was classified as popular.
We found that pmx demonstrated a healthy version release cadence and project activity because the last version was released less than a year ago. It has 3 open source maintainers collaborating on the project.
Did you know?

Socket for GitHub automatically highlights issues in each pull request and monitors the health of all your open source dependencies. Discover the contents of your packages and block harmful activity before you install or update your dependencies.

Product
Socket for Jira lets teams turn alerts into Jira tickets with manual creation, automated ticketing rules, and two-way sync.

Company News
Socket won two 2026 Reppy Awards from RepVue, ranking in the top 5% of all sales orgs. AE Alexandra Lister shares what it's like to grow a sales career here.

Security News
NIST will stop enriching most CVEs under a new risk-based model, narrowing the NVD's scope as vulnerability submissions continue to surge.