Radar Screen React Component
Overview
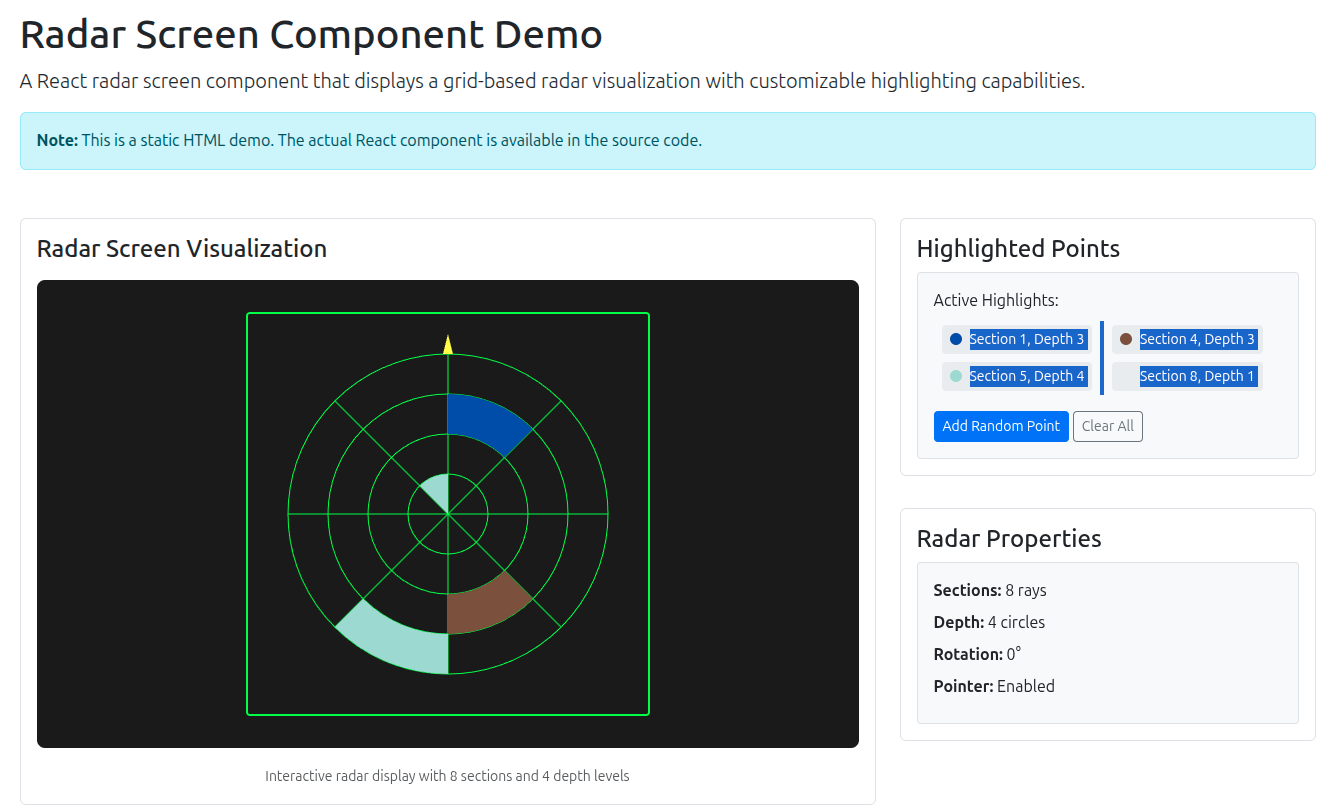
Class_Radar_Screen is a powerful React component that creates an interactive radar-like visualization. It displays a customizable grid system with radial sections and concentric circles, supporting dynamic highlighting, rotation, and distance calculations. Perfect for visualizing spatial data, sensor readings, or any grid-based information.
🆕 Recent Updates (v1.1.0)
Major Features
- 🎯 Radar Visualization: Canvas-based rendering for smooth performance
- 🎨 Dynamic Highlighting: Real-time point highlighting with custom colors
- 🔄 Dual Rotation System: Initial offset + continuous rotation
- 📏 Distance Display: Automatic distance calculation and labeling
- 🧭 North Pointer: Optional directional indicator
- ⚡ High Performance: Optimized canvas rendering with efficient redraws
Technical Improvements
- React class component with lifecycle optimization
- Efficient canvas rendering with minimal redraws
- Prop-based configuration system
- Responsive design with automatic scaling
- Cross-browser compatible
🔄 Rotation System Explained
The component features a dual rotation system for precise control:
📐 rotation_steps (Initial Offset)
- Purpose: Sets the initial grid alignment/offset
- Function: Discrete step-based rotation
- Formula:
(rotation_steps × π) / sections
- Use Case: Align radar with specific directions (North, East, etc.)
Example with 8 sections:
rotation_steps = 0 → Default position (0°)rotation_steps = 1 → Shift by 1 section (45°)rotation_steps = 2 → Shift by 2 sections (90°)
🔄 rotation (Continuous)
- Purpose: Fine-grained rotation and animation
- Function: Continuous rotation in radians
- Use Case: Animation, precise positioning, real-time updates
💡 Combined Usage
<Class_Radar_Screen
sections={8}
rotation_steps={2}
rotation={currentAngle}
highlighted_points={data}
draw_pointer={true}
/>
Features
- Grid System: Configurable number of radial sections and depth levels
- Dynamic Highlighting: Real-time highlighting of grid sections with custom colors
- Dual Rotation Control: Initial offset + continuous rotation
- Distance Display: Automatic distance calculation and display for highlighted areas
- North Pointer: Optional directional arrow indicator
- Canvas Rendering: High-performance HTML5 canvas-based visualization
- Responsive Design: Automatic scaling and responsive layout
- Easy Integration: Simple prop-based configuration
🚀 Quick Start
Option 1: HTML Demo (Fastest)
Open the included demo file in your browser to see the component in action:
open demo.html
Option 2: React Development
npm install
npm start
npm run example
Option 3: Build for Production
npm run build
Installation
📦 NPM Installation
npm install radar_screen_react
🌐 GitHub Repository
Available on GitHub: https://github.com/HefnySco/radar_screen_react
git clone https://github.com/HefnySco/radar_screen_react.git
cd radar_screen_react
npm install
Dependencies
- React 16.8+ (for class component support)
- Modern browser with HTML5 Canvas support
📖 Usage Guide
Basic Usage
import React from 'react';
import { Class_Radar_Screen } from 'radar_screen_react';
const MyComponent = () => {
const highlightedPoints = [
[3, 2, '#ff0000'],
[5, 4, '#00ff00']
];
return (
<Class_Radar_Screen
sections={8}
depth={4}
rotation_steps={0}
rotation={0}
highlighted_points={highlightedPoints}
draw_pointer={true}
/>
);
};
Real-World Example
import React, { useState } from 'react';
import { Class_Radar_Screen } from 'radar_screen_react';
const SensorDashboard = () => {
const [sensorData, setSensorData] = useState([
[1, 3, '#ff6b6b'],
[4, 2, '#4ecdc4'],
[7, 4, '#feca57']
]);
const addSensorReading = (section, depth, severity) => {
const colors = {
low: '#2ecc71',
medium: '#f39c12',
high: '#e74c3c'
};
setSensorData(prev => [...prev, [section, depth, colors[severity]]]);
};
return (
<div className="container">
<h4>Radar Sensor Dashboard</h4>
<div className="row">
<div className="col-md-8">
<div style={{ backgroundColor: '#1a1a1a', padding: '2rem' }}>
<Class_Radar_Screen
sections={8}
depth={5}
rotation_steps={0}
rotation={0}
highlighted_points={sensorData}
draw_pointer={true}
/>
</div>
</div>
<div className="col-md-4">
<div className="card">
<div className="card-header">
<h5>Sensor Controls</h5>
</div>
<div className="card-body">
<button
className="btn btn-sm btn-primary mb-2"
onClick={() => addSensorReading(2, 3, 'low')}
>
Add Low Alert
</button>
<button
className="btn btn-sm btn-warning mb-2"
onClick={() => addSensorReading(5, 2, 'medium')}
>
Add Medium Alert
</button>
<button
className="btn btn-sm btn-danger mb-2"
onClick={() => addSensorReading(8, 4, 'high')}
>
Add High Alert
</button>
<button
className="btn btn-sm btn-outline-secondary"
onClick={() => setSensorData([])}
>
Clear All
</button>
</div>
</div>
</div>
</div>
</div>
);
};
Advanced Configuration
const AdvancedRadar = () => {
const [rotation, setRotation] = useState(0);
const [highlights, setHighlights] = useState([]);
useEffect(() => {
const interval = setInterval(() => {
setRotation(prev => (prev + Math.PI / 180) % (Math.PI * 2));
}, 50);
return () => clearInterval(interval);
}, []);
return (
<Class_Radar_Screen
sections={12}
depth={6}
rotation_steps={3}
rotation={rotation}
highlighted_points={highlights}
draw_pointer={true}
/>
);
};
📋 Props Reference
sections | number | 8 | No | Number of radial sections (rays) |
depth | number | 4 | No | Number of concentric circles |
rotation_steps | number | 0 | No | Initial grid offset in section steps (0-sections) |
rotation | number | 0 | No | Continuous rotation in radians |
highlighted_points | array | [] | No | Array of [section, depth, color] points |
draw_pointer | boolean | false | No | Draw north arrow pointer |
🔄 Rotation Props Explained
rotation_steps (Initial Offset)
- Type: Number (0 to sections)
- Purpose: Sets initial grid alignment
- Calculation:
(rotation_steps × π) / sections
- Example:
rotation_steps={2} on 8 sections = 90° offset
rotation (Continuous)
- Type: Number (radians)
- Purpose: Fine rotation and animation
- Range: Any real number
- Example:
rotation={Math.PI / 4} = 45° continuous rotation
highlighted_points Format
const highlighted_points = [
[section, depth, color],
[3, 2, '#ff0000'],
[5, 4, '#00ff00']
];
🎨 Styling and Customization
Container Styling
<div style={{
backgroundColor: '#1a1a1a',
padding: '2rem',
borderRadius: '0.5rem',
boxShadow: '0 4px 6px rgba(0, 0, 0, 0.1)'
}}>
<Class_Radar_Screen {...props} />
</div>
Canvas Customization
The component uses a 400x400 canvas with responsive scaling:
<div style={{ width: '100%', maxWidth: '500px' }}>
<Class_Radar_Screen {...props} />
</div>
🔄 Component Lifecycle
The component efficiently handles updates through React's lifecycle methods:
- componentDidMount: Initial radar draw and highlight application
- componentDidUpdate: Selective redraw only when sections/depth change
- highlightSection: Efficient highlighting without full redraw
🌐 Browser Support
- Chrome 60+
- Firefox 55+
- Safari 12+
- Edge 79+
🛠 Development
Available Scripts
npm run build
npm run start
npm run example
npm run dev
Project Structure
radar_screen_react/
├── src/
│   └── jsc_mctrl_radar_screen.jsx  # Component implementation
├── example.js                       # React example application
├── demo.html                        # Static HTML demo
├── package.json                     # Dependencies and scripts
└── README.md                        # This file
🎯 Use Cases
1. Sensor Visualization
Perfect for displaying sensor data from IoT devices, radar systems, or spatial monitoring.
2. Gaming Interfaces
Create mini-maps, radar displays, or spatial indicators for games and simulations.
3. Data Analytics
Visualize multi-dimensional data in a radial format for easy pattern recognition.
4. Navigation Systems
Display directional information, proximity alerts, or spatial relationships.
5. Control Panels
Create intuitive control interfaces for industrial or aerospace applications.
🔧 Troubleshooting
Common Issues
Q: Radar not displaying highlights
A: Ensure the highlighted_points array follows the format [section, depth, color] and that section/depth values are within the configured ranges.
Q: Canvas appears blank
A: Check that the component has sufficient container dimensions. The canvas needs at least 100px width/height to render properly.
Q: Performance issues with frequent updates
A: The component only redraws when sections or depth props change. Highlighting updates are optimized to avoid full redraws.
Q: Rotation not working as expected
A: Remember the dual rotation system:
rotation_steps = Initial grid offset (discrete steps)rotation = Continuous rotation (radians)- Try combining both:
rotation_steps={2} for 90° offset + rotation={Math.PI/4} for additional 45°
Q: Highlights not rotating with radar
A: This is the correct behavior! Highlights rotate WITH the grid automatically. The component uses the same rotation calculation for both grid and highlights.
Q: rotation_steps vs rotation - which to use?
A: Use rotation_steps for:
- Setting initial radar orientation
- Aligning with compass directions (North, East, South, West)
- Discrete positioning
Use rotation for:
- Animation and continuous movement
- Fine-tuning adjustments
- Real-time rotation updates
Getting Help
- 📖 Check the
demo.html file for visual examples with interactive controls
- 📱 Review the
example.js file for React implementation with rotation controls
- 🐛 Open an issue on GitHub for bug reports
- 📋 Check the component props documentation for configuration options
- 🎯 Try the interactive demo to understand rotation behavior
📄 License
MIT License - see LICENSE file for details.
🤝 Contributing
- Fork the repository
- Create your feature branch (
git checkout -b feature/amazing-feature)
- Commit your changes (
git commit -m 'Add amazing feature')
- Push to the branch (
git push origin feature/amazing-feature)
- Open a Pull Request
📋 Changelog
v1.1.0 (Current)
- Breaking Changes: Complete refactor from tri-state checkbox to radar screen component
- Added: Canvas-based radar visualization with grid system
- Added: Dynamic highlighting with custom colors
- Added: Rotation control and north pointer functionality
- Added: Distance calculation and display
- Improved: Performance with optimized canvas rendering
- Updated: Documentation with comprehensive examples and use cases
v1.0.5
- Previous tri-state checkbox component (deprecated)
🔧 Advanced Examples
Real-time Data Visualization
const RealTimeRadar = () => {
const [data, setData] = useState([]);
useEffect(() => {
const interval = setInterval(() => {
const newDataPoint = [
Math.floor(Math.random() * 8) + 1,
Math.floor(Math.random() * 4) + 1,
`#${Math.floor(Math.random()*16777215).toString(16)}`
];
setData(prev => [...prev.slice(-9), newDataPoint]);
}, 1000);
return () => clearInterval(interval);
}, []);
return (
<Class_Radar_Screen
sections={8}
depth={4}
highlighted_points={data}
draw_pointer={true}
/>
);
};
Interactive Radar
const InteractiveRadar = () => {
const [highlights, setHighlights] = useState([]);
const handleCanvasClick = (event) => {
const rect = event.target.getBoundingClientRect();
const x = event.clientX - rect.left;
const y = event.clientY - rect.top;
const section = Math.floor(Math.random() * 8) + 1;
const depth = Math.floor(Math.random() * 4) + 1;
setHighlights(prev => [...prev, [section, depth, '#ff0000']]);
};
return (
<div onClick={handleCanvasClick}>
<Class_Radar_Screen
sections={8}
depth={4}
highlighted_points={highlights}
draw_pointer={true}
/>
</div>
);
};
Transform your data visualization with the powerful and flexible Radar Screen component! 🎯


