React Calendar Heatmap Chart
An effective and customizable calendar heatmap chart for React applications. This library helps you create a calendar heatmap, similar to Kite (Zerodha), Angel One, TradingView, but with additional powerful features:
- 🔀 Customizable date option
- 🗓️ Full control over layout and UI
- 🖥️ Plugin system for extended functionality
- ⚡ Lightweight with high speed
- ✅ Supports dynamic data updates
- ♾️ And many more...
🎮 Try it Out
Check out the live demo on CodeSandbox:
🔗 Live Demo
📦 Installation
Install via npm or yarn:
npm install react-calendar-heatmap-chart
yarn add react-calendar-heatmap-chart
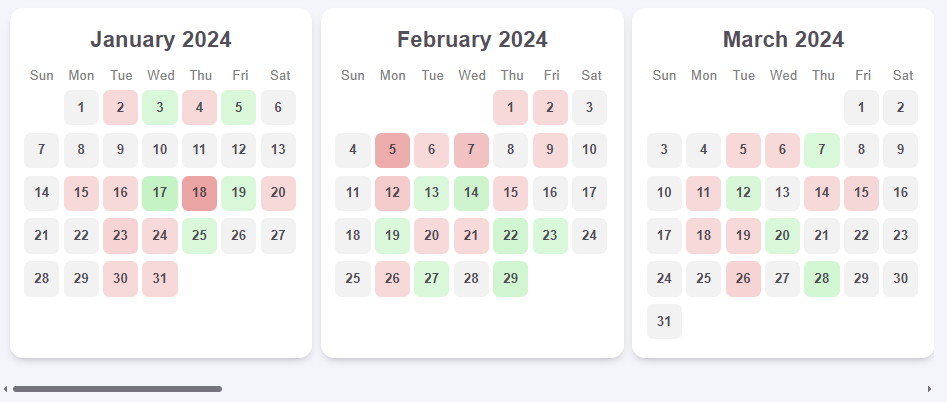
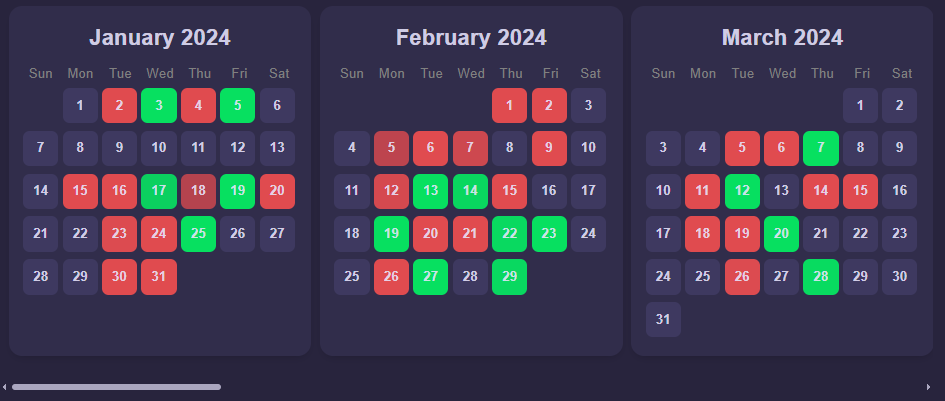
📸 Outputs
Light Mode:
Dark Mode:
Props
data | Array | Array of objects containing date (YYYY-MM-DD) and net_profit_loss values. |
displayDate | Boolean | If true, the date will be displayed on hover. |
mode | String | Theme mode, can be "light" or "dark". Defaults to "light". |
bgColor | String | Background color of the heatmap. Accepts any valid CSS color value. |
🚀 Usage
import { HeatmapCalendarChart } from "react-calendar-heatmap-chart";

export default function Heatmap() {
  const data = [
    { date: "2025-01-06", net_profit_loss: -78 },
    { date: "2025-01-09", net_profit_loss: 79 },
    { date: "2025-01-27", net_profit_loss: -73 },
    { date: "2025-01-26", net_profit_loss: 82 },
    { date: "2025-01-08", net_profit_loss: 70 },
    { date: "2025-02-24", net_profit_loss: 58 },
    { date: "2025-02-08", net_profit_loss: -81 },
    { date: "2025-02-28", net_profit_loss: 16 },
    { date: "2025-02-04", net_profit_loss: 75 },
    { date: "2025-02-17", net_profit_loss: 15 },
  ];

  return (
    <HeatmapCalendarChart
      mode="dark"
      data={data}
      displayDate={true}
      bgColor={"#28243D"}
    />
  );
}
📜 License
This project is licensed under the MIT License.
🏗️ Repository
🔗 GitHub Repository
🤝 Contributing
Contributions, issues, and feature requests are welcome! Feel free to check issues and make pull requests.
📬 Reach Out to Me
If you have any questions, need clarification, or want to discuss something related to the project, feel free to reach out:


