React Chart Race
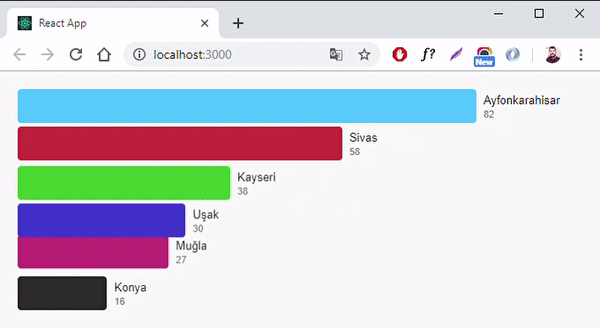
The animated bar chart race helps you visualize your changing data in a wonderful way. It is quite easy to understand. A rising or decreasing bar moves up or down along with the animation.
Image
Features
- The bars move in an animated way.
- You can change all colors as you wish.
- You can add as many bars as you want.
- You can define individual colors for each bar.
- The height of the field is calculated automatically based on the number of bars added.
- The width of the bars is calculated proportionally according to the entered values.
- Just setState for the animation to work.
Installation
npm install --save react-chart-race
Import
import ChartRace from 'react-chart-race';
Parameters
| data | Array | [] | Data required for drawing the graph. |
| backgroundColor | String | #f9f9f9 | The background color of the field. |
| width | Number | 680 | The width of the field. |
| padding | Number | 20 | The internal space of the field. |
| itemHeight | Number | 38 | The height of a bar. |
| gap | Number | 4 | Space between the bars from the outside. |
| titleStyle | Style | { font: 'normal 400 13px Arial', color: '#212121' } | The style values of the title. |
| valueStyle | Style | { font: 'normal 400 11px Arial', color: '#777' } | The style values of the value. |
Simple Usage
An element must consist of 4 variables: id, title, value, color
<ChartRace data={[
  { id: 0, title: 'Ayfonkarahisar', value: 42, color: '#50c4fe' },
  { id: 1, title: 'Kayseri', value: 38, color: '#3fc42d' },
  { id: 2, title: 'Muğla', value: 76, color: '#c33178' },
  { id: 3, title: 'Uşak', value: 30, color: '#423bce' },
  { id: 4, title: 'Sivas', value: 58, color: '#c8303b' },
  { id: 5, title: 'Konya', value: 16, color: '#2c2c2c' }
]} />
Advanced Usage
import React, { Component } from 'react';
import ChartRace from 'react-chart-race';

export default class App extends Component{

  constructor(props){
    super(props);
    this.state = {
      data: []
    };
    this.handleChange();
    setInterval(() => {
      this.handleChange();
    }, 2000);
  }

  getRandomInt(min, max){
    min = Math.ceil(min);
    max = Math.floor(max);
    return Math.floor(Math.random() * (max - min + 1)) + min;
  }

  handleChange(){
    const data = [
      { id: 0, title: 'Ayfonkarahisar', value: this.getRandomInt(10, 90), color: '#50c4fe' },
      { id: 1, title: 'Kayseri', value: 38, color: '#3fc42d' },
      { id: 2, title: 'Muğla', value: this.getRandomInt(10, 90), color: '#c33178' },
      { id: 3, title: 'Uşak', value: this.getRandomInt(10, 90), color: '#423bce' },
      { id: 4, title: 'Sivas', value: 58, color: '#c8303b' },
      { id: 5, title: 'Konya', value: 16, color: '#2c2c2c' }
    ];
    this.setState({ data });
  }

  render(){
    return(
      <div>
        <ChartRace
          data={this.state.data}
          backgroundColor='#000'
          width={760}
          padding={12}
          itemHeight={58}
          gap={12}
          titleStyle={{ font: 'normal 400 13px Arial', color: '#fff' }}
          valueStyle={{ font: 'normal 400 11px Arial', color: 'rgba(255,255,255, 0.42)' }}
        />
      </div>
    );
  }

}
If you want, you can also integrate the new values of the data on a socket connection.
License
MIT


