react-grid-heatmapjs
React for the user interface, Tailwind CSS for styling, and CSS Grid for layout. A heatmap is a data visualization technique that uses color to represent the magnitude of values within a two-dimensional grid or matrix.
Properties
| title (optional) | string | Title for Heatmap Heading |
| colorRange | {
from: number,
to: number,
color: string,
name:string
}[] | from: The lowest value in the range.,
to: The highest value in the range.,
color: The color of cells that fall within the range, specified in hexadecimal format.,
name: The name of the range, which will appear in the legend. |
| series | {
name: string,
data: number[],
total?: number[]
}[] | name: becomes the y-axis label
data: values
total: To display the total of row data on the right side of the heatmap along the Y-axis.. |
| xaxis | {
labels: string[],
totals?: number[]
} | labels: label property becomes the label for the x-axis
totals: To display the total of column data beneath the label. |
Examples
import { HeatMap } from "react-grid-heatmapjs";
import "react-grid-heatmapjs/dist/style.css";
const data = {
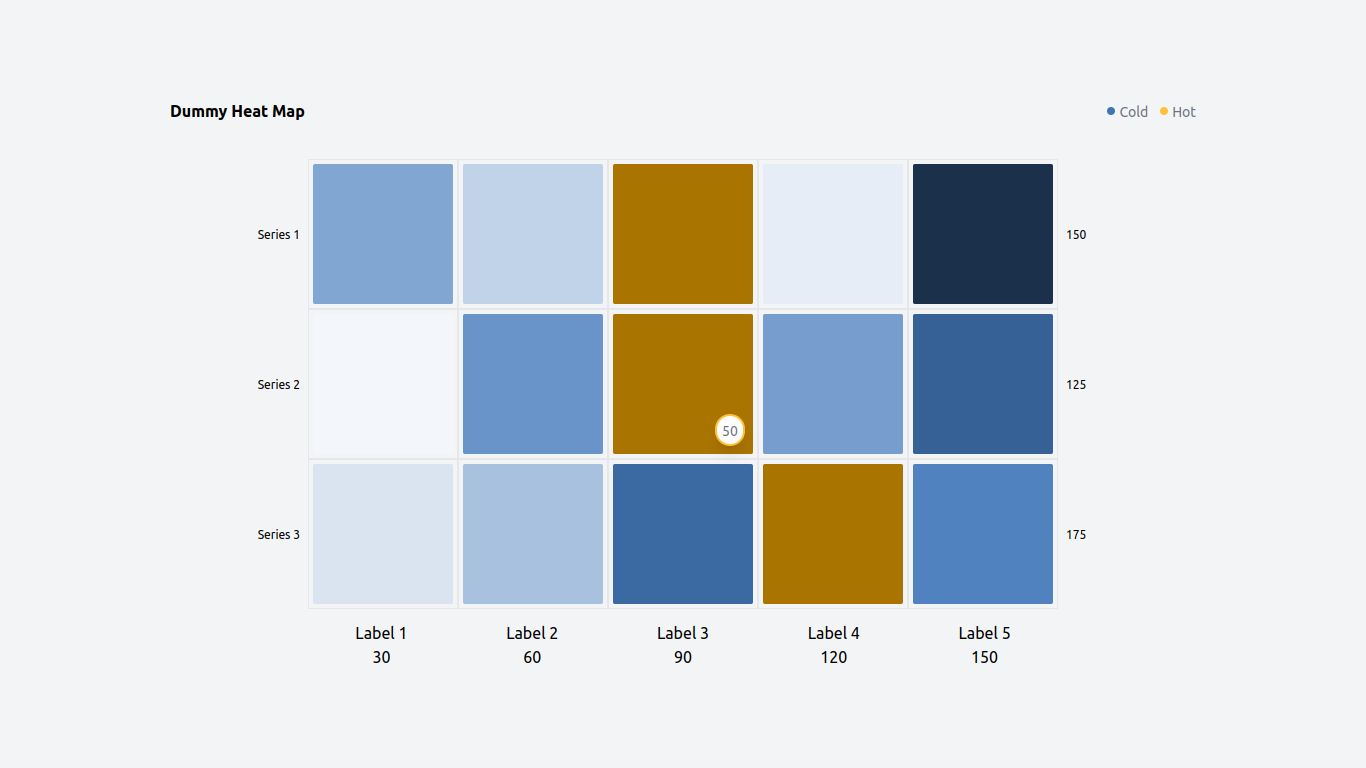
title: "Dummy Heat Map",
colorRange: [
{
from: 0,
to: 30,
color: "#4074b3",
name: "Cold",
},
{
from: 30,
to: 60,
color: "#ffc039",
name: "Hot",
},
],
series: [
{
name: "Series 1",
data: [10, 5, 50, 2, 25],
total: 150,
},
{
name: "Series 2",
data: [1, 12, 50, 11, 18],
total: 125,
},
{
name: "Series 3",
data: [3, 7, 17, 50, 14],
total: 175,
},
],
xaxis: {
labels: ["Label 1", "Label 2", "Label 3", "Label 4", "Label 5"],
totals: [30, 60, 90, 120, 150],
},
};
<HeatMap
title={data.title}
colorRange={data.colorRange}
series={data.series}
xaxis={data.xaxis}
/>
The data above will produce this heatmap.
For developers
Getting the Source Code
Clone this package:
git clone https://github.com/hex909/react-heatmapjs.git
Installing Dependencies
Navigate to the package's root directory and install the required dependencies:
cd react-heatmapjs
npm install
Testing Locally with npm link
To test this Package locally, you can use npm link to create a symbolic link between your local development directory and your application. Follow these steps:
- Navigate to the root directory of this Package project.
- Run the following command to build the package:
npm run build
- Run the following command to create a global link for your package:
npm link
- Navigate to the directory of your application where you want to test the local package.
- Run the following command to link this Package to your application:
npm link react-heatmapjs