
Research
Security News
The Growing Risk of Malicious Browser Extensions
Socket researchers uncover how browser extensions in trusted stores are used to hijack sessions, redirect traffic, and manipulate user behavior.
By Kush Pandya - Jun 13, 2025
react-vis-graph-wrapper
Advanced tools
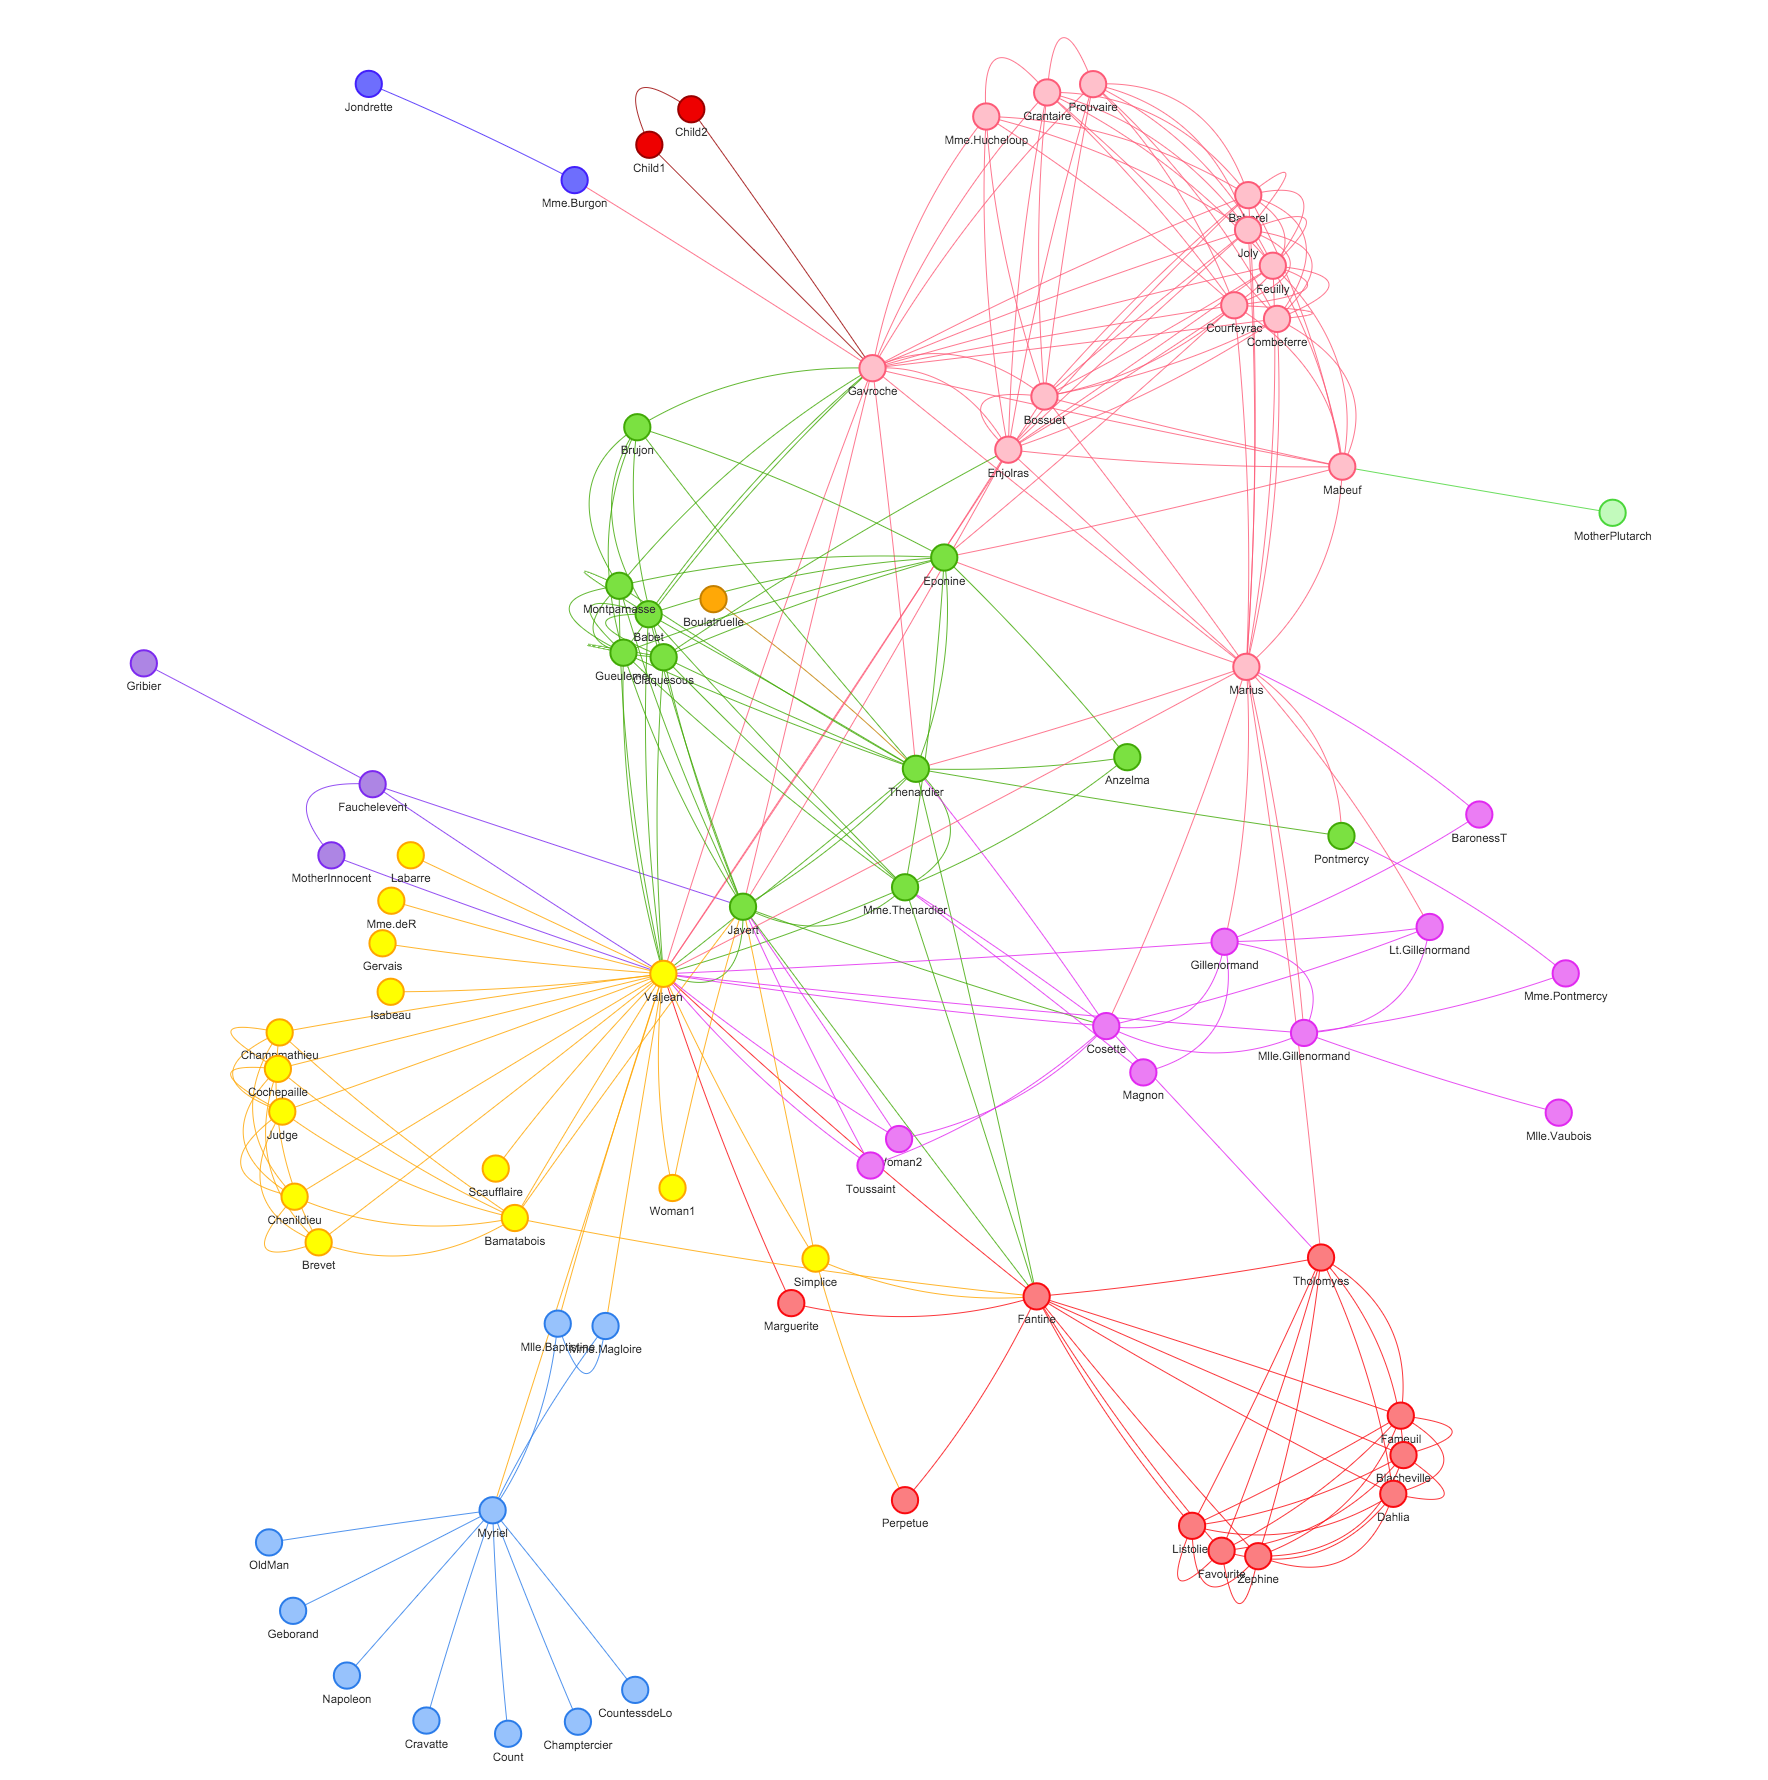
A React component to display beautiful network graphs using vis.js
A React component to display beautiful network graphs using vis.js
Show, don't tell: Demo
Make sure to visit visjs.org for more info.
Rendered graphs are scrollable, zoomable, retina ready, dynamic, and switch layout on double click.
This package is a complete rewrite of react-graph-vis started by ZachHaber in this gist mentioned somewhere deep in issues. Component is rewriten to function component for strict mode compliance and typing support is added (currently no types for specific GraphEvents - feel free to contribute) There was also added additional support for resizing windows.
Due to the imperative nature of vis.js, updating graph properties causes complete redraw of graph and completely porting it to React is a big project itself!
This component takes three vis.js configuration objects as properties:
import React from 'react';
import './App.css';
import VisGraph, {
GraphData,
GraphEvents,
Options,
} from 'react-vis-graph-wrapper';
function App() {
const graph: GraphData = {
nodes: [
{ id: 1, label: 'Node 1', title: 'node 1 tootip text' },
{ id: 2, label: 'Node 2', title: 'node 2 tootip text' },
{ id: 3, label: 'Node 3', title: 'node 3 tootip text' },
{ id: 4, label: 'Node 4', title: 'node 4 tootip text' },
{ id: 5, label: 'Node 5', title: 'node 5 tootip text' },
],
edges: [
{ from: 1, to: 2 },
{ from: 1, to: 3 },
{ from: 2, to: 4 },
{ from: 2, to: 5 },
],
};
const options: Options = {
layout: {
hierarchical: true,
},
edges: {
color: '#000000',
},
height: '500px',
};
const events: GraphEvents = {
select: (event: any) => {
const { nodes, edges } = event;
console.log(nodes, edges);
},
};
return (
<VisGraph
graph={graph}
options={options}
events={events}
getNetwork={(network: any) => {
// if you want access to vis.js network api you can set the state in a parent component using this property
console.log(network);
}}
/>
);
}
const rootElement = document.getElementById("root");
ReactDOM.render(<App />, rootElement);
You can also check out the demo in the example folder.
FAQs
A React component to display beautiful network graphs using vis.js
The npm package react-vis-graph-wrapper receives a total of 675 weekly downloads. As such, react-vis-graph-wrapper popularity was classified as not popular.
We found that react-vis-graph-wrapper demonstrated a not healthy version release cadence and project activity because the last version was released a year ago. It has 1 open source maintainer collaborating on the project.
Did you know?

Socket for GitHub automatically highlights issues in each pull request and monitors the health of all your open source dependencies. Discover the contents of your packages and block harmful activity before you install or update your dependencies.
Research
Security News
Socket researchers uncover how browser extensions in trusted stores are used to hijack sessions, redirect traffic, and manipulate user behavior.

Research
Security News
An in-depth analysis of credential stealers, crypto drainers, cryptojackers, and clipboard hijackers abusing open source package registries to compromise Web3 development environments.

Security News
pnpm 10.12.1 introduces a global virtual store for faster installs and new options for managing dependencies with version catalogs.