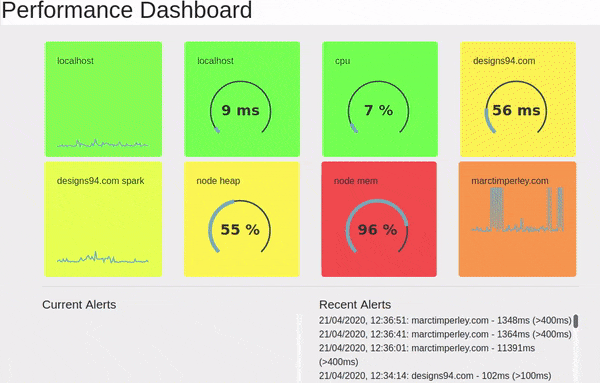
dashboard
Performance measurement dashboard with configurable metrics and end-point monitoring. Ideally suited to API microservices.


Getting Started
IMPORTANT This should only be used to monitor servers and services that you have responsibility for.
- Clone or download the project
- Modify the
measurements.json as required (see below)
- Run
npm install to get all the dependencies
- Run
npm start to start the server
- Point the browser at the server (http://localhost:4000)
Prerequisites
Configuring measurements.json
- Edit the existing file
- Any number of measurements can be added, but may impact performance and usability if you have too many
- Existing measurements for local CPU and memory are included
- You can measure the performance of any URL:
- use
/api/proxy/url?url=www.example.com as the url
- use
response as the value
- If you want to record any other metric(s) from an API endpoint, create a new .js file in proxy as a copy of one of the existing files and include the metric(s) you want in the JSON response. The example
random_number.js gets a random number from the remote CSRNG (https://csrng.net) site and parses the JSON response to display on the dashboard
Each measurement has the following keys:
"name": "designs94.com spark", // name of the chart

"location": "board4", // location on the page

"url": "/api/proxy/url?url=http://designs94.com", // url to call

"value": "response", // value to get from JSON response [optional] [default: response time, ms]

"chartType": "spark", // 'spark' line or 'gauge'

"max": 300, // upper limit of chart [optional] [default:100]

"threshold": 250, // alerting threshold [optional] [default:100]

"data": [] //required for chartType = spark
Using for your project
- Follow the steps in getting started
- Disconnect the git repo with
git init
- Add your own git repo using
git remote add origin [url]
- Push to your repo with
git push --set-upstream origin master
- Change the links in this readme.md file as required
- Configure the measurements.json as needed
Running the tests
To run the tests, jest must be installed.
- run
npm test to execute the tests. Shipped tests include validation that routes are loaded and the application has been built correctly.
You are strongly encouraged to write your own tests for any functionality and routes you develop. Check __tests__/example.test.js for an example.
Dependencies
The application relies on got. There are no other dependencies.
Documentation
Documentation is available at './docs/response-dashboard/1.0.16/index.html'
Contributing and Code of Conduct 
Please read CONTRIBUTING.md for details on the code of conduct, and the process for submitting pull requests.
Authors
- Marc Timperley - Initial work
License
This project is licensed under the MIT License - see the LICENSE.md file for details
ToDo
Acknowledgments