

Security News
Crates.io Users Targeted by Phishing Emails
The Rust Security Response WG is warning of phishing emails from rustfoundation.dev targeting crates.io users.
By Sarah Gooding - Sep 12, 2025
simple-ascii-chart
Advanced tools


Simple ASCII Chart is a TypeScript package for creating customizable ASCII charts in the terminal. It supports two-dimensional data, multiple series, custom colors, and formatters, making it a versatile solution for terminal-based data visualization.
Playground and documentation NPM
Install the package using yarn (or npm):
yarn add simple-ascii-chart
# or
npm install simple-ascii-chart
In ESM (e.g., TypeScript, modern Node.js)
import plot from 'simple-ascii-chart';
// or, if you prefer named imports:
import { plot } from 'simple-ascii-chart';

const graph = plot(input, settings);
console.log(graph);
In CommonJS (e.g., legacy Node.js)
// Option 1: access default export
const plot = require('simple-ascii-chart').default;

// Option 2: use named export
const { plot } = require('simple-ascii-chart');

const graph = plot(input, settings);
console.log(graph);
Create charts interactively in the playground.
Generate charts via the API by sending a POST request with your input data:
curl -d input='[[1,2],[2,3],[3,4]]' -G https://simple-ascii-chart.vercel.app/api
Or pass it as a URL parameter:
https://simple-ascii-chart.vercel.app/api?input=[[1,2],[2,3],[3,4]]&settings={%22width%22:50}
Input data should be a two-dimensional array of points or an array of arrays for multiple series:
type Point = [x: number, y: number];
type Input = Point[] | Point[][];
Single series
const input = [
  [1, 1],
  [2, 4],
  [3, 40],
];
Multiple series
const input = [
  [
    [0, 18],
    [1, 1],
    [2, 3],
  ],
  [
    [4, 1],
    [5, 0],
    [6, 1],
  ],
];
Point: A single point with x and y coordinates, represented as [x, y].MaybePoint: Allows partial or undefined values within a point, accommodating incomplete data.SingleLine: A series of connected points representing a single line.MultiLine: A collection of SingleLine arrays for multiple data series.Customize the plot function with a variety of settings:
| Option | Description |
|---|---|
color | Colors for the graph. Options include 'ansiRed', 'ansiGreen', etc. Multiple colors are accepted for series. |
width | Sets the graph width. |
height | Sets the graph height. |
axisCenter | Specifies the center of the axis as [x, y], with default as bottom-left. |
formatter | A function to format axis labels, offering custom display styles. |
lineFormatter | Function to define custom styles for each line. |
title | Title of the chart, displayed above the graph. |
xLabel | Label for the x-axis. |
yLabel | Label for the y-axis. |
thresholds | Defines threshold lines or points with optional colors at specific x or y coordinates. |
points | Defines points with optional colors at specific x or y coordinates. |
fillArea | Fills the area under each line, suitable for area charts. |
hideXAxis | Hides the x-axis. |
hideYAxis | Hides the y-axis. |
mode | Sets the plotting mode (line, point, bar, horizontal bar), defaults to line |
symbols | Symbols for customizing the chart’s appearance, including axis, background, and chart symbols. |
legend | Configuration for a legend, showing series names and position options (left, right, top, bottom). |
debugMode | Enables debug mode (default = false). |
| Setting | Description |
|---|---|
yRange | Specifies the y-axis range as [min, max]. |
showTickLabel | Enables tick labels on the axis, improving readability for larger plots. |
legend | Configures legend display with position and series names, such as { position: 'top', series: ['Series 1', 'Series 2'] }, thresholds: ['first', 'second'], points: ['1', '2']]. |
ColorGetter | A function for dynamic color assignment based on series or coordinates. |
axisCenter | Sets a custom origin point for the chart, shifting the chart layout to focus around a particular point. |
lineFormatter | Customize each line using the format `lineFormatter: (args: LineFormatterArgs) => CustomSymbol |
formatterHelpers | Provides helpers such as axis type and range for detailed formatting of axis labels. |
Overrides default symbols. Three independent sections are: empty - background, axis - symbols used to draw axis, chart - symbols used to draw graph.
symbols: {
  background: ' ',
  border: undefined,
  point: '●',
  thresholds:{
    x: '━',
    y: '┃',
  },
  empty: ' ',
  axis: {
    n: '▲',
    ns: '│',
    y: '┤',
    nse: '└',
    x: '┬',
    we: '─',
    e: '▶',
  },
  chart: {
    we: '━',
    wns: '┓',
    ns: '┃',
    nse: '┗',
    wsn: '┛',
    sne: '┏',
    area: '█'
    }
}
Settings = {
  color?: Colors; // Colors for the plot lines or areas
  width?: number; // Width of the plot
  height?: number; // Height of the plot
  yRange?: [number, number]; // Range of y-axis values
  showTickLabel?: boolean; // Option to show tick labels on the axis
  hideXAxis?: boolean; // Option to hide the x-axis
  hideYAxis?: boolean; // Option to hide the y-axis
  title?: string; // Title of the plot
  xLabel?: string; // Label for the x-axis
  yLabel?: string; // Label for the y-axis
  thresholds?: Threshold[]; // Array of threshold lines
  points?: GraphPoint[] // Array of points to render
  fillArea?: boolean; // Option to fill the area under lines
  legend?: Legend; // Legend settings
  axisCenter?: MaybePoint; // Center point for axes alignment
  formatter?: Formatter; // Custom formatter for axis values
  lineFormatter?: (args: LineFormatterArgs) => CustomSymbol | CustomSymbol[]; // Custom line formatter
  symbols?: Symbols; // Custom symbols for chart elements
};
Input:
plot(
  [
    [1, 1],
    [2, 4],
    [3, 4],
    [4, 2],
    [5, -1],
  ],
  { width: 9, height: 6 },
);
Expected Output:
  ▲
 4┤ ┏━━━┓
  │ ┃   ┃
 2┤ ┃   ┗━┓
 1┤━┛     ┃
  │       ┃
-1┤       ┗━
  └┬─┬─┬─┬─┬▶
   1 2 3 4 5
Input:
plot(
  [
    [1, 1],
    [2, 4],
    [3, 4],
    [4, 2],
    [5, -1],
    [6, 3],
    [7, -1],
    [8, 9],
  ],
  { title: 'Important data', width: 20, height: 8 },
);
Expected Output:
Important data
  ▲
 9┤                  ┏━
  │                  ┃
  │                  ┃
 4┤  ┏━━━━┓          ┃
 3┤  ┃    ┃     ┏━┓  ┃
 2┤  ┃    ┗━━┓  ┃ ┃  ┃
 1┤━━┛       ┃  ┃ ┃  ┃
-1┤          ┗━━┛ ┗━━┛
  └┬──┬─┬──┬──┬──┬─┬──┬▶
   1  2 3  4  5  6 7  8
Input:
plot(
  [
    [1, 1],
    [2, 4],
    [3, 4],
    [4, 2],
    [5, -1],
    [6, 3],
    [7, -1],
    [8, 9],
  ],
  { xLabel: 'x', yLabel: 'y', width: 20, height: 8 },
);
Expected Output:
   ▲
  9┤                  ┏━
   │                  ┃
   │                  ┃
  4┤  ┏━━━━┓          ┃
  3┤  ┃    ┃     ┏━┓  ┃
y 2┤  ┃    ┗━━┓  ┃ ┃  ┃
  1┤━━┛       ┃  ┃ ┃  ┃
 -1┤          ┗━━┛ ┗━━┛
   └┬──┬─┬──┬──┬──┬─┬──┬▶
    1  2 3  4  5  6 7  8
             x
Input:
plot(
  [
    [
      [1, 1],
      [2, 2],
      [3, 4],
      [4, 6],
    ],
    [
      [5, 4],
      [6, 1],
      [7, 2],
      [8, 3],
    ],
  ],
  {
    width: 20,
    fillArea: true,
    color: ['ansiGreen', 'ansiBlue'],
    legend: { position: 'bottom', series: ['first', 'second'] },
  },
);
Expected Output:
 ▲
6┤       ██
 │       ██
4┤    █████  ███
3┤    █████  ███    ██
2┤  ███████  ███ █████
1┤█████████  █████████
 └┬──┬─┬──┬──┬──┬─┬──┬▶
  1  2 3  4  5  6 7  8
█ first
█ second
Input:
plot(
  [
    [1, 1],
    [2, 4],
    [3, 4],
    [4, 2],
    [5, -1],
    [6, 3],
    [7, -1],
    [8, 9],
  ],
  { symbols: { border: '█' }, xLabel: 'x', yLabel: 'y', width: 20, height: 8 },
);
Expected Output:
███████████████████████████
█   ▲                     █
█  9┤                  ┏━ █
█   │                  ┃  █
█   │                  ┃  █
█  4┤  ┏━━━━┓          ┃  █
█  3┤  ┃    ┃     ┏━┓  ┃  █
█y 2┤  ┃    ┗━━┓  ┃ ┃  ┃  █
█  1┤━━┛       ┃  ┃ ┃  ┃  █
█ -1┤          ┗━━┛ ┗━━┛  █
█   └┬──┬─┬──┬──┬──┬─┬──┬▶█
█    1  2 3  4  5  6 7  8 █
█             x           █
███████████████████████████
Input:
plot(
  [
    [
      [1, 1],
      [2, 2],
      [3, 4],
      [4, 6],
    ],
    [
      [1, 4],
      [2, 1],
      [3, 2],
      [4, 3],
    ],
  ],
  {
    fillArea: true,
    color: ['ansiGreen', 'ansiBlue'],
  },
);
Expected Output:
  ▲
 6┤  ██
  │  ██
 4┤████
 3┤████
 2┤████
 1┤████
  └┬┬┬┬▶
   1234
Input:
plot(
  [
    [1, 1],
    [2, 4],
    [3, 40],
    [4, 2],
    [5, -1],
    [6, 3],
    [7, -1],
    [8, -1],
    [9, 9],
    [10, 9],
  ],
  { width: 40, height: 10 },
);
Expected Output:
   ▲
 40┤        ┏━━━┓
   │        ┃   ┃
   │        ┃   ┃
   │        ┃   ┃
   │        ┃   ┃
   │        ┃   ┃
   │        ┃   ┃
  9┤        ┃   ┃                     ┏━━━━━
  3┤   ┏━━━━┛   ┗━━━┓    ┏━━━┓        ┃
 -1┤━━━┛            ┗━━━━┛   ┗━━━━━━━━┛
   └┬───┬────┬───┬───┬────┬───┬───┬────┬───┬▶
    1   2    3   4   5    6   7   8    9   10
Input:
plot(
  [
    [1, 1],
    [2, 4],
    [3, 4],
    [4, 2],
    [5, -1],
    [6, 3],
    [7, -1],
    [8, 9],
  ],
  {
    width: 40,
    thresholds: [
      {
        y: 5,
        x: 5,
      },
      {
        x: 2,
      },
    ],
  },
);
Expected Output:
  ▲     ┃               ┃
 9┤     ┃               ┃                ┏━
  │     ┃               ┃                ┃
  │     ┃               ┃                ┃
  │━━━━━┃━━━━━━━━━━━━━━━━━━━━━━━━━━━━━━━━━━━
  │     ┃               ┃                ┃
 4┤     ┃━━━━━━━━━━┓    ┃                ┃
 3┤     ┃          ┃    ┃     ┏━━━━┓     ┃
 2┤     ┃          ┗━━━━┃     ┃    ┃     ┃
 1┤━━━━━┃               ┃     ┃    ┃     ┃
  │     ┃               ┃     ┃    ┃     ┃
-1┤     ┃               ┃━━━━━┛    ┗━━━━━┛
  └┬─────┬────┬─────┬────┬─────┬────┬─────┬▶
   1     2    3     4    5     6    7     8
Input:
plot(
    [
      [
        [1, 2],
        [2, -2],
        [3, 4],
        [4, 1],
      ],
      [
        [1, 6],
        [2, -3],
        [3, 0],
        [4, 0],
      ],
    ],
    {
      width: 40,
      color: ['ansiGreen', 'ansiMagenta', 'ansiBlack', 'ansiYellow'],
      legend: {
        position: 'left',
        series: ['series 1', 'series 2'],
        points: ['point 1', 'point 2', 'point 3'],
        thresholds: ['threshold 1', 'threshold 2'],
      },
      title: 'Points',
      thresholds: [
        {
          y: 5,
          x: 2,
          color: 'ansiBlue',
        },
        {
          y: 2,
          color: 'ansiGreen',
        },
      ],
      points: [
        {
          y: 5,
          x: 5,
          color: 'ansiBlue',
        },
        {
          y: -1,
          x: 1,
          color: 'ansiCyan',
        },
        {
          y: 2,
          x: 2,
          color: 'ansiRed',
        },
      ],
    },
);
Expected Output:
Points
█ series 1     ▲             ┃
█ series 2    6┤━━━━━━━━━━━━┓┃
               │━━━━━━━━━━━━━━━━━━━━━━━━━━━━━━━━━━━━━━━━━●
┃ threshold 1 4┤            ┃┃           ┏━━━━━━━━━━━━┓
┃ threshold 2  │            ┃┃           ┃            ┃
              2┤━━━━━━━━━━━━━●━━━━━━━━━━━━━━━━━━━━━━━━━━━
● point 1     1┤            ┃┃           ┃            ┗━
● point 2     0┤            ┃┃           ┏━━━━━━━━━━━━━━
● point 3      │●           ┃┃           ┃
             -2┤            ┃┃━━━━━━━━━━━┃
             -3┤            ┗┃━━━━━━━━━━━┛
               └┬────────────┬────────────┬────────────┬▶
                1            2            3            4
Input:
plot(
  [
      [1, 1],
      [2, 4],
      [3, 4],
      [4, 2],
      [5, -1],
      [6, 3],
      [7, -1],
      [8, 9],
    ],
    {
      width: 40,
      title: 'Points',
      points: [
        {
          y: 5,
          x: 5,
          color: 'ansiBlue',
        },
        {
          y: -1,
          x: 1,
          color: 'ansiBlue',
        },
        {
          y: 205,
          x: 1005,
          color: 'ansiBlue',
        },
        {
          y: 2,
          x: 2,
          color: 'ansiRed',
        },
      ],
    },
);
Expected Output:
Points
  ▲
 9┤                                      ┏━
  │                                      ┃
  │                                      ┃
  │                                      ┃
  │                      ●               ┃
 4┤     ┏━━━━━━━━━━┓                     ┃
 3┤     ┃          ┃          ┏━━━━┓     ┃
 2┤     ┃●         ┗━━━━┓     ┃    ┃     ┃
 1┤━━━━━┛               ┃     ┃    ┃     ┃
  │                     ┃     ┃    ┃     ┃
-1┤●                    ┗━━━━━┛    ┗━━━━━┛
  └┬─────┬────┬─────┬────┬─────┬────┬─────┬▶
   1     2    3     4    5     6    7     8
Input:
plot(
  [
    [
      [0, 18],
      [1, 1],
      [2, 3],
      [3, 11],
      [4, 5],
      [5, 16],
      [6, 17],
      [7, 14],
      [8, 7],
      [9, 4],
    ],
    [
      [0, 0],
      [1, 1],
      [2, 1],
      [3, 1],
      [4, 1],
      [5, 0],
      [6, 1],
      [7, 0],
      [8, 1],
      [9, 0],
    ],
  ],
  { width: 40, height: 10, color: ['ansiBlue', 'ansiGreen'] },
);
Expected Output:
   ▲
 17┤━━━━┓                           ┏━━━━┓
 16┤    ┃                     ┏━━━━━┛    ┃
 14┤    ┃                     ┃          ┗━━━━━┓
 11┤    ┃          ┏━━━━━┓    ┃                ┃
   │    ┃          ┃     ┃    ┃                ┃
  7┤    ┃          ┃     ┃    ┃                ┗━━━━┓
  5┤    ┃          ┃     ┗━━━━┛                     ┃
  4┤    ┃     ┏━━━━┛                                ┗━
  1┤    ┏━━━━━━━━━━━━━━━━━━━━━┓     ┏━━━━┓     ┏━━━━┓
  0┤━━━━┛                     ┗━━━━━┛    ┗━━━━━┛    ┗━
   └┬────┬─────┬────┬─────┬────┬─────┬────┬─────┬────┬▶
    0    1     2    3     4    5     6    7     8    9
Input:
plot(
  [
    [
      [0, -10],
      [1, 0.001],
      [2, 10],
      [3, 200],
      [4, 10000],
      [5, 2000000],
      [6, 50000000],
    ],
  ],
  {
    width: 30,
    height: 20,
    formatter: (n: number, { axis }: FormatterHelpers) => {
      const labels = ['A', 'B', 'C', 'D', 'E', 'F', 'G'];
      if (axis === 'y') return n;
      return labels[n] || 'X';
    },
  },
);
Expected Output:
         ▲
 50000000┤                            ┏━
         │                            ┃
         │                            ┃
         │                            ┃
         │                            ┃
         │                            ┃
         │                            ┃
         │                            ┃
         │                            ┃
         │                            ┃
         │                            ┃
         │                            ┃
         │                            ┃
         │                            ┃
         │                            ┃
         │                            ┃
         │                            ┃
         │                            ┃
  2000000┤                       ┏━━━━┛
      -10┤━━━━━━━━━━━━━━━━━━━━━━━┛
         └┬────┬────┬────┬───┬────┬────┬▶
          A    B    C    D   E    F    G
Input:
plot(
  [
    [
      [-8, -8],
      [-4, -4],
      [-3, -3],
      [-2, -2],
      [-1, -1],
      [0, 0],
      [2, 2],
      [3, 3],
      [4, 4],
      [8, 8],
    ],
  ],
  { width: 60, height: 20, axisCenter: [0, 0] },
);
Expected Output:
                                 ▲
                                8┤                           ┏━
                                 │                           ┃
                                 │                           ┃
                                 │                           ┃
                                 │                           ┃
                                4┤            ┏━━━━━━━━━━━━━━┛
                                3┤         ┏━━┛
                                2┤     ┏━━━┛
                                 │     ┃
  ┬──────────────┬──┬───┬───┬───0│─────────┬──┬──────────────┬─▶
 -8             -4 -3  -2  -1   0│     2   3  4              8
                            ┏━━-1┤
                        ┏━━━┛  -2┤
                    ┏━━━┛      -3┤
                 ┏━━┛          -4┤
                 ┃               │
                 ┃               │
                 ┃               │
                 ┃               │
   ━━━━━━━━━━━━━━┛             -8┤
                                 │
Input:
plot(
  [
    [1, 2],
    [2, 0],
    [3, 5],
    [4, 2],
    [5, -2],
    [6, 3],
  ],
  {
    symbols: {
      empty: 'x',
      empty: '-',
      axis: {
        n: 'A',
        ns: 'i',
        y: 't',
        nse: 'o',
        x: 'j',
        we: 'm',
        e: 'B',
      },
      chart: {
        we: '1',
        wns: '2',
        ns: '3',
        nse: '4',
        wsn: '5',
        sne: '6',
      },
    },
    width: 40,
    height: 10,
  },
);
Expected Output:
xxA-----------------------------------------
x5t---------------61111112------------------
xxi---------------3------3------------------
xxi---------------3------3------------------
x3t---------------3------3---------------61-
x2t11111112-------3------411111112-------3--
xxi-------3-------3--------------3-------3--
x0t-------411111115--------------3-------3--
xxi------------------------------3-------3--
xxi------------------------------3-------3--
-2t------------------------------411111115--
xxojmmmmmmmjmmmmmmmjmmmmmmjmmmmmmmjmmmmmmmjB
xxx1xxxxxxx2xxxxxxx3xxxxxx4xxxxxxx5xxxxxxx6x
Input:
plot(
  [
    [-5, 2],
    [2, -3],
    [13, 0.1],
    [4, 2],
    [5, -2],
    [6, 12],
  ],
  {
    width: 40,
    height: 10,
    hideYAxis: true,
    hideXAxis: true,
  },
);
Expected Output:
                           ┏━━━━━━━━━━━━━━┓
                           ┃              ┃
                           ┃              ┃
                           ┃              ┃
                           ┃              ┃
                           ┃              ┃
    ━━━━━━━━━━━━━━┓    ┏━┓ ┃              ┃
                  ┃    ┃ ┃ ┃              ┗━
                  ┃    ┃ ┗━┛
                  ┗━━━━┛
Input:
plot(
  [
    [-9000, 2000],
    [-8000, -3000],
    [-2000, -2000],
    [2000, 2000],
    [3000, 1500],
    [4000, 5000],
    [10000, 1400],
    [11000, 20000],
    [12000, 30000],
  ],
  {
    width: 60,
    height: 20,
  },
);
Expected Output:
      ▲
   30k┤                                                          ┏━
      │                                                          ┃
      │                                                          ┃
      │                                                          ┃
      │                                                          ┃
      │                                                          ┃
   20k┤                                                       ┏━━┛
      │                                                       ┃
      │                                                       ┃
      │                                                       ┃
      │                                                       ┃
      │                                                       ┃
      │                                                       ┃
      │                                                       ┃
    5k┤                                    ┏━━━━━━━━━━━━━━━┓  ┃
      │                                    ┃               ┃  ┃
  1.4k┤━━┓                           ┏━━━━━┛               ┗━━┛
      │  ┃                           ┃
   -2k┤  ┃                ┏━━━━━━━━━━┛
   -3k┤  ┗━━━━━━━━━━━━━━━━┛
      └┬──┬────────────────┬──────────┬──┬──┬───────────────┬──┬──┬▶
        -8k                          2k    4k                11k
     -9k                 -2k            3k                10k   12k
Input:
plot(
  [
    [1, 0],
    [2, 20],
    [3, 29],
    [4, 10],
    [5, 3],
    [6, 40],
    [7, 0],
    [8, 20],
  ],
  {
    height: 10,
    width: 30,
    lineFormatter: ({ y, plotX, plotY, input, index }) => {
      const output = [{ x: plotX, y: plotY, symbol: '█' }];

      if (input[index - 1]?.[1] < y) {
        return [...output, { x: plotX, y: plotY - 1, symbol: '▲' }];
      }

      return [...output, { x: plotX, y: plotY + 1, symbol: '▼' }];
    },
  },
);
Expected Output:
   ▲                     ▲
 40┤                     █
   │        ▲
 29┤        █
   │    ▲                        ▲
 20┤    █                        █
   │
   │
 10┤            █
  3┤            ▼    █
  0┤█                ▼       █
   └┬───┬───┬───┬────┬───┬───┬───┬▶
    1   2   3   4    5   6   7   8
Input:
plot(
  [
  [0, 3],
  [1, 2],
  [2, 3],
  [3, 4],
  [4, -2],
  [5, -5],
  [6, 2],
  [7, 0],
],
{
  title: 'bar chart with axis',
  mode: 'bar',
  showTickLabel: true,
  width: 40,
  axisCenter: [0, 0],
},
);
Expected Output:
bar chart with axis
  ▲                █
 4┤          █     █
 3┤     █    █     █               █
 2┤     █    █     █               █
 1┤     █    █     █               █     █
 0┤─────┬────┬─────┬────┬─────┬────┬─────┬─▶
-1┤     1    2     3    4     5    6     7
-2┤                           █
-3┤                           █
-4┤                           █
-5┤
  │
Input:
plot(
  [
    [0, 3],
    [1, 2],
    [2, 3],
    [3, 4],
    [4, -2],
    [5, -5],
    [6, 2],
    [7, 0],
  ],
  {
    mode: 'horizontalBar',
    showTickLabel: true,
    width: 40,
    height: 20,
    axisCenter: [3, 1],
  },
);
Expected Output:
                 ▲
                4┤
                 │
████████████████3┤
                 │
      ██████████2┤████████████████
                 │
┬─────┬────┬────1┤────┬─────┬────┬─────┬─▶
0     1    2     3    4     5    6     7
                0┤██████████████████████
                 │
               -1┤
                 │
               -2┤
                 │█████
               -3┤
                 │
               -4┤
                 │
                 │
               -5┤███████████
                 │
FAQs
Simple ascii chart generator
We found that simple-ascii-chart demonstrated a healthy version release cadence and project activity because the last version was released less than a year ago. It has 0 open source maintainers collaborating on the project.
Did you know?

Socket for GitHub automatically highlights issues in each pull request and monitors the health of all your open source dependencies. Discover the contents of your packages and block harmful activity before you install or update your dependencies.
Security News
The Rust Security Response WG is warning of phishing emails from rustfoundation.dev targeting crates.io users.
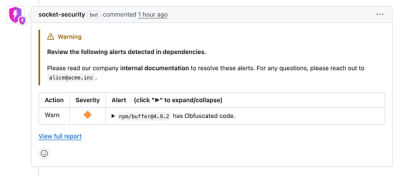
Product
Socket now lets you customize pull request alert headers, helping security teams share clear guidance right in PRs to speed reviews and reduce back-and-forth.

Product
Socket's Rust support is moving to Beta: all users can scan Cargo projects and generate SBOMs, including Cargo.toml-only crates, with Rust-aware supply chain checks.