Research
/Security News
Critical Vulnerability in NestJS Devtools: Localhost RCE via Sandbox Escape
A flawed sandbox in @nestjs/devtools-integration lets attackers run code on your machine via CSRF, leading to full Remote Code Execution (RCE).
stack-trace
Advanced tools
The stack-trace npm package is used to extract stack traces in Node.js applications. It provides a way to get structured stack trace information from the V8 stack frames, allowing developers to programmatically inspect and manipulate stack traces.
Get an array of CallSites from the current call stack
This feature allows you to retrieve an array of CallSite objects, each representing a frame in the call stack. This can be useful for debugging or logging purposes.
const stackTrace = require('stack-trace');
const trace = stackTrace.get();
console.log(trace);Parse an Error's stack trace
This feature enables you to parse the stack trace of a given Error object into a structured format, making it easier to read and process.
const stackTrace = require('stack-trace');
const error = new Error('Example error');
const parsedStack = stackTrace.parse(error);
console.log(parsedStack);This package is similar to stack-trace as it also parses stack traces from Error objects into a more readable format. It works in both browser and Node.js environments, which may give it a broader range of applicability compared to stack-trace.
stacktrace-js provides stack trace parsing and generation. It is designed to work in browsers, which is different from stack-trace that is Node.js specific. It offers more features for browser environments, such as source maps support.
traceback is another Node.js module for extracting stack traces. It offers a synchronous API to get the current stack trace, which is similar to stack-trace. However, it has not been updated recently, which might make stack-trace a more reliable choice for ongoing projects.
Get v8 stack traces as an array of CallSite objects.
npm install stack-trace
The stack-trace module makes it easy for you to capture the current stack:
import { get } from 'stack-trace';
const trace = get();

expect(trace[0].getFileName()).toBe(__filename);
However, sometimes you have already popped the stack you are interested in,
and all you have left is an Error object. This module can help:
import { parse } from 'stack-trace';
const err = new Error('something went wrong');
const trace = parse(err);

expect(trace[0].getFileName()).toBe(__filename);
Please note that parsing the Error#stack property is not perfect, only
certain properties can be retrieved with it as noted in the API docs below.
stack-trace works great with long-stack-traces, when parsing an err.stack
that has crossed the event loop boundary, a CallSite object returning
'----------------------------------------' for getFileName() is created.
All other methods of the event loop boundary call site return null.
Returns an array of CallSite objects, where element 0 is the current call
site.
When passing a function on the current stack as the belowFn parameter, the
returned array will only include CallSite objects below this function.
Parses the err.stack property of an Error object into an array compatible
with those returned by stackTrace.get(). However, only the following methods
are implemented on the returned CallSite objects.
Note: Except getFunctionName(), all of the above methods return exactly the
same values as you would get from stackTrace.get(). getFunctionName()
is sometimes a little different, but still useful.
The official v8 CallSite object API can be found [here][https://github.com/v8/v8/wiki/Stack-Trace-API#customizing-stack-traces]. A quick excerpt:
A CallSite object defines the following methods:
- getThis: returns the value of this
- getTypeName: returns the type of this as a string. This is the name of the function stored in the constructor field of this, if available, otherwise the object's [[Class]] internal property.
- getFunction: returns the current function
- getFunctionName: returns the name of the current function, typically its name property. If a name property is not available an attempt will be made to try to infer a name from the function's context.
- getMethodName: returns the name of the property of this or one of its prototypes that holds the current function
- getFileName: if this function was defined in a script returns the name of the script
- getLineNumber: if this function was defined in a script returns the current line number
- getColumnNumber: if this function was defined in a script returns the current column number
- getEvalOrigin: if this function was created using a call to eval returns a CallSite object representing the location where eval was called
- isToplevel: is this a toplevel invocation, that is, is this the global object?
- isEval: does this call take place in code defined by a call to eval?
- isNative: is this call in native V8 code?
- isConstructor: is this a constructor call?
stack-trace is licensed under the MIT license.
FAQs
Get v8 stack traces as an array of CallSite objects.
The npm package stack-trace receives a total of 13,028,064 weekly downloads. As such, stack-trace popularity was classified as popular.
We found that stack-trace demonstrated a not healthy version release cadence and project activity because the last version was released a year ago. It has 6 open source maintainers collaborating on the project.
Did you know?

Socket for GitHub automatically highlights issues in each pull request and monitors the health of all your open source dependencies. Discover the contents of your packages and block harmful activity before you install or update your dependencies.

Research
/Security News
A flawed sandbox in @nestjs/devtools-integration lets attackers run code on your machine via CSRF, leading to full Remote Code Execution (RCE).

Product
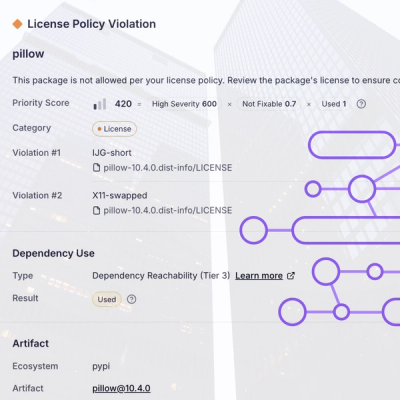
Customize license detection with Socket’s new license overlays: gain control, reduce noise, and handle edge cases with precision.

Product
Socket now supports Rust and Cargo, offering package search for all users and experimental SBOM generation for enterprise projects.