Research
Namastex.ai npm Packages Hit with TeamPCP-Style CanisterWorm Malware
Malicious Namastex.ai npm packages appear to replicate TeamPCP-style Canister Worm tradecraft, including exfiltration and self-propagation.
statsd-client
Advanced tools
Node.js client for statsd.
var SDC = require('statsd-client'),
sdc = new SDC({host: 'statsd.example.com'});
var timer = new Date();
sdc.increment('some.counter'); // Increment by one.
sdc.gauge('some.gauge', 10); // Set gauge to 10
sdc.timing('some.timer', timer); // Calculates time diff
sdc.histogram('some.histogram', 10, {foo: 'bar'}) // Histogram with tags
sdc.distribution('some.distribution', 10, {foo: 'bar'}) // Distribution with tags
sdc.close(); // Optional - stop NOW
var SDC = require('statsd-client'),
	sdc = new SDC({host: 'statsd.example.com', port: 8124});
Global options:
prefix: Prefix all stats with this value (default "").tcp: User specifically wants to use tcp (default false).socketTimeout: Dual-use timer. Will flush metrics every interval. For UDP,
it auto-closes the socket after this long without activity (default 1000 ms;
0 disables this). For TCP, it auto-closes the socket after socketTimeoutsToClose number of timeouts have elapsed without activity.tags: Object of string key/value pairs which will be appended on to all StatsD payloads (excluding raw payloads) (default {})UDP options:
host: Where to send the stats (default localhost).port: Port to contact the statsd-daemon on (default 8125).ipv6: Use IPv6 instead of IPv4 (default false).TCP options:
host: Where to send the stats (default localhost).port: Port to contact the statsd-daemon on (default 8125).socketTimeoutsToClose: Number of timeouts in which the socket auto-closes if it has been inactive. (default 10; 1 to auto-close after a single timeout).HTTP options:
host: The URL to send metrics to (default: http://localhost).headers: Additional headers to send (default {})method: What HTTP method to use (default PUT)To debug, set the environment variable NODE_DEBUG=statsd-client when running your program.
Counters are supported, both as raw .counter(metric, delta) and with the
shortcuts .increment(metric, [delta=1]) and .decrement(metric, [delta=-1]):
sdc.increment('systemname.subsystem.value'); // Increment by one
sdc.decrement('systemname.subsystem.value', -10); // Decrement by 10
sdc.counter('systemname.subsystem.value', 100); // Increment by 100
Sends an arbitrary number to the back-end:
sdc.gauge('what.you.gauge', 100);
sdc.gaugeDelta('what.you.gauge', 20);  // Will now count 120
sdc.gaugeDelta('what.you.gauge', -70); // Will now count 50
sdc.gauge('what.you.gauge', 10);       // Will now count 10
Send unique occurences of events between flushes to the back-end:
sdc.set('your.set', 200);
Keep track of how fast (or slow) your stuff is:
var start = new Date();
setTimeout(function () {
	sdc.timing('random.timeout', start);
}, 100 * Math.random());
If it is given a Date, it will calculate the difference, and anything else
will be passed straight through.
And don't let the name (or nifty interface) fool you - it can measure any kind of number, where you want to see the distribution (content lengths, list items, query sizes, ...)
Many implementations (though not the official one from Etsy) support
histograms as an alias/alternative for timers. So aside from the fancy bits
with handling dates, this is much the same as .timing().
Datadog's specific implementation supports another alternative to timers/histograms,
called the distribution metric type.
From the client's perspective, this is pretty much an alias to histograms and can be used via .distribution().
Passes a raw string to the underlying socket. Useful for dealing with custom statsd-extensions in a pinch.
sdc.raw('foo.bar:123|t|@0.5|#key:value');
All the methods above support metric level tags as their last argument. Just like global tags, the format for metric tags is an object of string key/value pairs. Tags at the metric level overwrite global tags with the same key.
sdc.gauge('gauge.with.tags', 100, {foo: 'bar'});
There's also a helper for measuring stuff in Express.js via middleware:
var SDC = require('statsd-client');
var app = express();
	sdc = new SDC({...});

app.use(sdc.helpers.getExpressMiddleware('somePrefix'));
// or
app.get('/',
	sdc.helpers.getExpressMiddleware('otherPrefix'),
	function (req, res, next) { req.pipe(res); });

app.listen(3000);
This will count responses by status-code (prefix.<statuscode>) and the
overall response-times.
It can also measure per-URL (e.g. PUT to /:user/:thing will become
PUT_user_thing by setting the timeByUrl: true in the options-object:
app.use(sdc.helpers.getExpressMiddleware('prefix', { timeByUrl: true }));
As the names can become rather odd in corner-cases (esp. regexes and non-REST
interfaces), you can specify another value by setting res.locals.statsdUrlKey
at a later point.
The / page will appear as root (e.g. GET_root) in metrics while any not found route will appear as {METHOD}_unknown_express_route. You can change that name by setting the notFoundRouteName in the middleware options.
There's also a helper for measuring stuff with regards to a callback:
var SDC = requrire('statsd-client');
	sdc = new SDC({...});

function doSomethingAsync(arg, callback) {
	callback = sdc.helpers.wrapCallback('somePrefix', callback);
	// ... do something ...
	return callback(null);
}
The callback is overwritten with a shimmed version that counts the
number of errors (prefix.err) and successes (prefix.ok) and
the time of execution of the function (prefix.time).
You invoked the shimmed callback exactly the same way as though
there was no shim at all. Yes, you get metrics for your function in
a single line of code.
Note that the start of execution time is marked as soon as you
invoke sdc.helpers.wrapCallback().
You can also provide more options:
sdc.helpers.wrapCallback('somePrefix', callback, {
	tags: { foo: 'bar' }
});
By default, the socket is closed if it hasn't been used for a second (see
socketTimeout in the init-options), but it can also be force-closed with
.close():
var start = new Date();
setTimeout(function () {
	sdc.timing('random.timeout', start); // 2 - implicitly re-creates socket.
	sdc.close(); // 3 - Closes socket after last use.
}, 100 * Math.random());
sdc.close(); // 1 - Closes socket early.
The call is idempotent, so you can call it "just to be sure". And if you submit new metrics later, the socket will automatically be re-created, and a new timeout-timer started.
The library supports getting "child" clients with extra prefixes, to help with making sane name-spacing in apps:
// Create generic client
var sdc = new StatsDClient({host: 'statsd.example.com', prefix: 'systemname'});
sdc.increment('foo'); // Increments 'systemname.foo'
... do great stuff ...

// Subsystem A
var sdcA = sdc.getChildClient('a');
sdcA.increment('foo'); // Increments 'systemname.a.foo'

// Subsystem B
var sdcB = sdc.getChildClient('b');
sdcB.increment('foo'); // Increments 'systemname.b.foo'
Internally, they all use the same socket, so calling .close() on any of them
will allow the entire program to stop gracefully.
Check the GitHub issues.
See the changelog.
ISC - see LICENSE.
FAQs
Yet another client for Etsy's statsd
The npm package statsd-client receives a total of 28,310 weekly downloads. As such, statsd-client popularity was classified as popular.
We found that statsd-client demonstrated a not healthy version release cadence and project activity because the last version was released a year ago. It has 2 open source maintainers collaborating on the project.
Did you know?

Socket for GitHub automatically highlights issues in each pull request and monitors the health of all your open source dependencies. Discover the contents of your packages and block harmful activity before you install or update your dependencies.

Research
Malicious Namastex.ai npm packages appear to replicate TeamPCP-style Canister Worm tradecraft, including exfiltration and self-propagation.

Product
Explore exportable charts for vulnerabilities, dependencies, and usage with Reports, Socket’s new extensible reporting framework.

Product
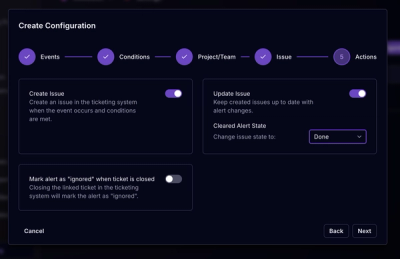
Socket for Jira lets teams turn alerts into Jira tickets with manual creation, automated ticketing rules, and two-way sync.