
Product
Rust Support Now in Beta
Socket's Rust support is moving to Beta: all users can scan Cargo projects and generate SBOMs, including Cargo.toml-only crates, with Rust-aware supply chain checks.
By Mikola Lysenko, Trevor Norris - Sep 11, 2025
taiko-diagnostics
Advanced tools

![]()


A plugin for taiko which provides some diagnostics features like measuring speedindex, performance metrics of webpage.
npm install taiko-diagnostics --saveimport { openBrowser, goto, closeBrowser, diagnostics } from 'taiko';
const {
startTracing,
startCssTracing,
stopCssTracing,
endTracing,
getSpeedIndex,
getPerformanceMetrics
} = diagnostics;
jest.setTimeout(30000);
beforeEach(async () => {
await openBrowser();
});
afterEach(async () => {
await closeBrowser();
});
test('Should return speedindex and perceptualSpeedIndex', async () => {
await startTracing();
await goto('https://github.com/');
await endTracing();
const { speedIndex, perceptualSpeedIndex } = await getSpeedIndex();
expect(speedIndex).toBeTruthy();
expect(perceptualSpeedIndex).toBeTruthy();
});
startTracing() CommandStart tracing the browser. Tracing could be started only once per browser.
startTracing();
endTracing CommandStop tracing the browser.
endTracing();
getTracingLogs CommandReturns the tracelogs that was captured within the tracing period. You can use this command to store the trace logs on the file system to analyse the trace via Chrome DevTools interface.
startTracing();
goto('https://github.com/');
endTracing();

fs.writeFileSync(
  '/path/to/tracelog.json',
  JSON.stringify(await getTracingLogs())
);
getSpeedIndex CommandReturns the Speed Index and Perceptual Speed Index from the page load that happened between the tracing period.
startTracing();
goto('https://github.com/');
endTracing();

console.log(getSpeedIndex());
// outputs
// { speedIndex: 789.6634800064564,
//   perceptualSpeedIndex: 876.0901860232523 }
getPerformanceMetrics CommandstartTracing();
goto('https://github.com/');
endTracing();
console.log(getPerformanceMetrics());
// outputs
//{
// firstPaint: 735.666,
// firstContentfulPaint: 735.669,
// firstMeaningfulPaint: 735.671,
// domContentLoaded: 574.546,
// timeToFirstInteractive: 735.671,
// load: 1379.895
// }
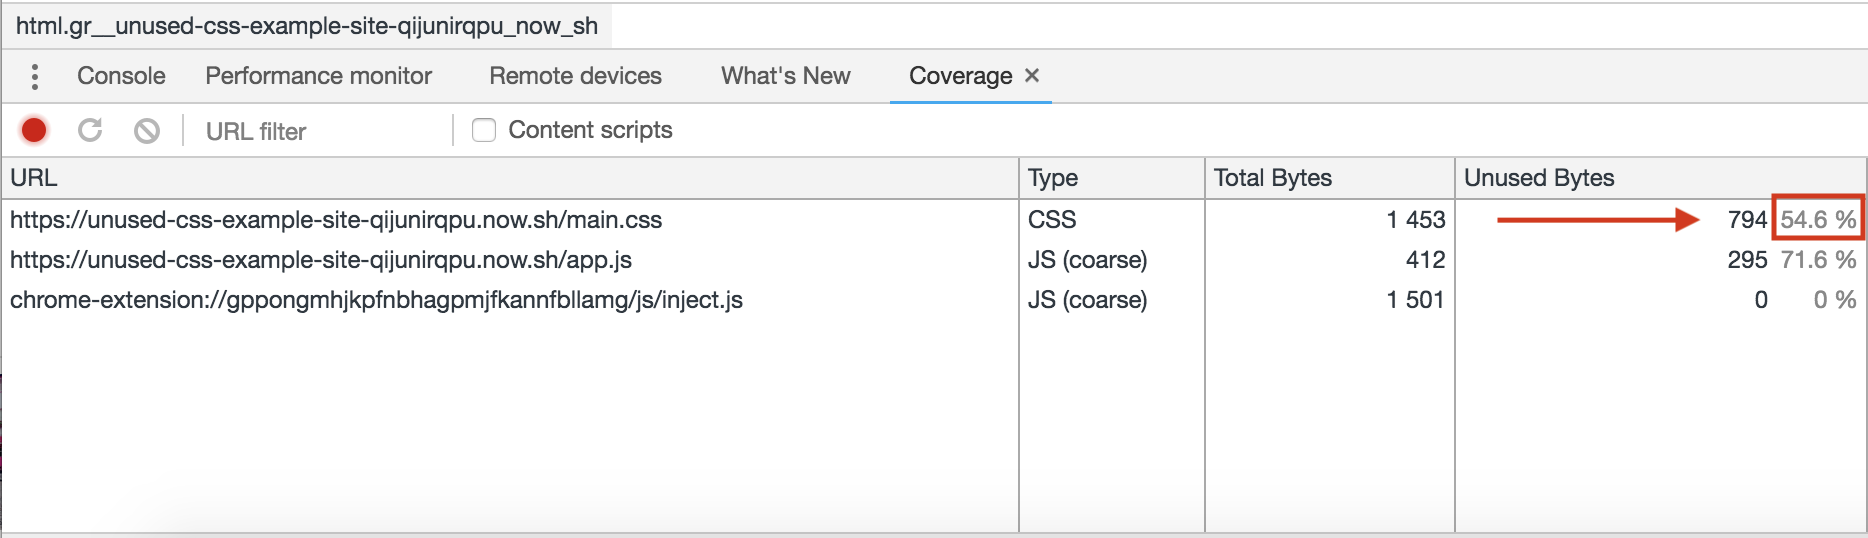
getCssCoverage CommandstartCssTracing();
goto('https://unused-css-example-site-qijunirqpu.now.sh');
const cssCoverage = await stopCssTracing();
//[ { url: 'https://unused-css-example-site-qijunirqpu.now.sh/main.css',
// type: 'CSS',
// totalBytes: 1453,
// usedBytesTotal: 653,
// unusedBytesTotal: 800,
// usedPercentage: 44.941500344115624,
// unusedPercentage: 55.058499655884376 } ]
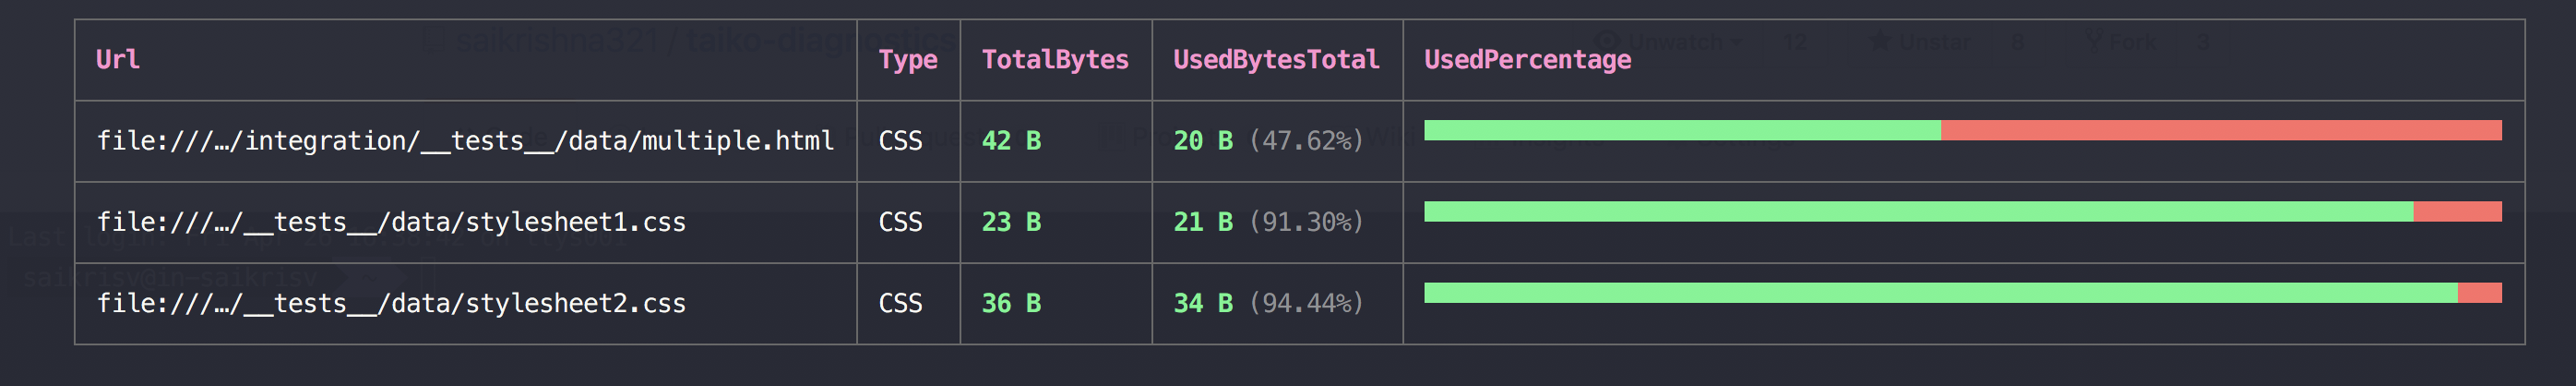
await prettyCSS(coverage);
logConsoleInfo commandconst error = [];
let emitter = await logConsoleInfo();
emitter.on('pageError', e => { // Other emitters - logEntry, consoleLog
error.push(e);
});
await goto('gauge.org/sdfsd');
Make sure not to add `await` as logConsoleInfo enables log Listener.
//{
//"source":"network",
//"level":"error",
//"text":"Failed to load resource: the server responded with a status of 404 ()",
//"timestamp":1553288625400,
//"url":"https://gauge.org/sdfsd",
//"networkRequestId":"D56332F8080344A2696C18D0771EC383"
//}
To launch the REPL type taiko --plugin taiko-diagnostics in your favorite terminal application. This will launch the Taiko Prompt.
e.g
Version: 0.7.0 (Chromium:74.0.3723.0) Type .api for help and .exit to quit
You should now have full access to all of the diagnostics in the taiko REPL window
> openBrowser()
 ✔ Browser opened
> startTracing()
 ✔ Browser tracing started
> goto('https://github.com/');
 ✔ Navigated to url "https://github.com/"
> endTracing();
 ✔ Browser tracing ended
> getSpeedIndex();
{ speedIndex: 30631.375729995667,
  perceptualSpeedIndex: 30634.177980202476 }
> getPerformanceMetrics();
info Detected renderer thread by 'TracingStartedInBrowser' event: pid 69317, tid 775
{ firstPaint: 834.819,
  firstContentfulPaint: 834.821,
  firstMeaningfulPaint: 997.381,
  domContentLoaded: 1073.878,
  timeToFirstInteractive: 1194.132,
  load: 1208.64 }
Note that startTracing,endTracing, and getSpeedIndex apis are not from taiko. These are given by the plugin.
FAQs
A plugin for taiko which provides some diagnostics features
We found that taiko-diagnostics demonstrated a not healthy version release cadence and project activity because the last version was released a year ago. It has 1 open source maintainer collaborating on the project.
Did you know?

Socket for GitHub automatically highlights issues in each pull request and monitors the health of all your open source dependencies. Discover the contents of your packages and block harmful activity before you install or update your dependencies.
Product
Socket's Rust support is moving to Beta: all users can scan Cargo projects and generate SBOMs, including Cargo.toml-only crates, with Rust-aware supply chain checks.
Product
Socket Fix 2.0 brings targeted CVE remediation, smarter upgrade planning, and broader ecosystem support to help developers get to zero alerts.

Security News
Socket CEO Feross Aboukhadijeh joins Risky Business Weekly to unpack recent npm phishing attacks, their limited impact, and the risks if attackers get smarter.