Product
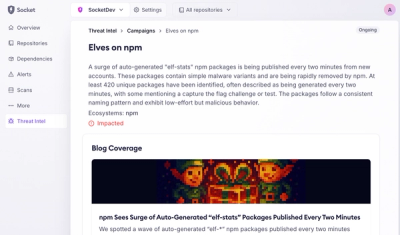
Introducing Supply Chain Attack Campaigns Tracking in the Socket Dashboard
Campaign-level threat intelligence in Socket now shows when active supply chain attacks affect your repositories and packages.
A debug module that helps capture the debug context, plus object tracing information to help you better vizualise debug output
npm install vizbug
Consider the following example
class Storage {
  constructor () {
    this.debug = vizbug()
    this.debug('new instance')
  }

  write (data, cb) {
    this.debug('writing data to storage %b', data)
    setImmediate(cb)
  }
}

class DataStructure {
  constructor () {
    this.debug = vizbug()
    this.debug('new instance')
    this.storage = new Storage()
  }

  addData (data, cb) {
    this.debug('adding data to data structure %b', data)
    setImmediate(() =>{
      this.storage.write(data, cb)
    })
  }
}

const d = new DataStructure()

d.addData(Buffer.alloc(1000), function () {
  console.log('data added')
})
Running this with vizbug enabled produces the following debug output:
{"topic":"DataStructure","message":"new instance","filename":"/vizbug/example.js","line":18,"id":1,"context":1,"tracing":[],"date":"2019-09-25T09:39:13.803Z"}
{"topic":"Storage","message":"new instance","filename":"/vizbug/example.js","line":6,"id":2,"context":2,"tracing":[],"date":"2019-09-25T09:39:13.805Z"}
{"topic":"DataStructure","message":"adding data to data structure <0x00000000... (1000 b)>","filename":"/vizbug/example.js","line":23,"id":3,"context":1,"tracing":[1],"date":"2019-09-25T09:39:13.806Z"}
{"topic":"Storage","message":"writing data to storage <0x00000000... (1000 b)>","filename":"/vizbug/example.js","line":10,"id":4,"context":2,"tracing":[1],"date":"2019-09-25T09:39:13.808Z"}
For each object created a context integer helps you group which debug statements are related to each context.
In addition any object passed to vizbug is added to an internal tracing map. This tracing map help you figure out how contexts relate to each other. For example in our above gist, the same data is passed down from the data structure to the storage abstraction. We can see that in the above output as both tracing arrays share the same tracing id.
Using the tracing information we can infer the coupling between contexts when debugging which can help us find issues.
log = vizbug([topic])Create a new log function. Per default this function is a noop unless the VIZBUG env var has been set.
If you set VIZBUG=true or VIZBUG=stdout, the debug logs will be printed to stdout.
If you set VIZBUG=stderr it will be printed to stderr and finally VIZBUG=filename will store the debug
logs as newline delimited JSON in that file.
Optionally pass a debug topic. If you don't pass a bug it will be inferred based on the class or function name of the callee.
vizbug.enabledBoolean telling you if the vizbug debugger is enabled.
log(message, ...traces)Log a debug message. Will print a JSON message containing
You can add format options to your message to print traces.
%b will insert a buffer digest%o will JSON.stringify a trace.%s will print a string%d, %i will print a number.MIT
FAQs
A context aware debug logger
We found that vizbug demonstrated a not healthy version release cadence and project activity because the last version was released a year ago. It has 1 open source maintainer collaborating on the project.
Did you know?

Socket for GitHub automatically highlights issues in each pull request and monitors the health of all your open source dependencies. Discover the contents of your packages and block harmful activity before you install or update your dependencies.

Product
Campaign-level threat intelligence in Socket now shows when active supply chain attacks affect your repositories and packages.

Research
Malicious PyPI package sympy-dev targets SymPy users, a Python symbolic math library with 85 million monthly downloads.

Security News
Node.js 25.4.0 makes require(esm) stable, formalizing CommonJS and ESM compatibility across supported Node versions.