Security News
/Research
Wallet-Draining npm Package Impersonates Nodemailer to Hijack Crypto Transactions
Malicious npm package impersonates Nodemailer and drains wallets by hijacking crypto transactions across multiple blockchains.
vue-d3-barchart
Advanced tools
Small component to draw charts using d3 v4

npm install vue-d3-barchart --save
  ...
  <d3-barchart :data='data' :options='options'/>
  ...
import D3BarChart from 'vue-d3-barchart'
...
  components: {
    D3BarChart
  },
....
<style src="vue-d3-barchart/dist/vue-d3-barchart.css"></style>
Or: import source component from: 'vue-d3-barchart/src/vue-d3-barchart.vue' And install devDependencies. (d3-scale, stylus and pug) See: package.json)
data: Array of values or objects (see options: getX,getY)
options:
size:{w,h}
getX: function(d)
getY: function(d)
labels: Boolean show axis labels
axis: { valuesY:Boolean, valuesX:boolean, linesX:boolean, linesY:boolean } render axis
axisTicks
padding: 0.1 bar padding
colors: Array | Object
colorInterpol: Function | name of D3 function
colorScale: Function | name of D3 function (colorInterpol Overrides this option)
colorCb: Color Function: (x,d) => {return color}, Overrides colorScale and colorInterpol
line: Boolean render line
formatX: Function(x) --> x
formatY: Function(y) --> y
formatLabel(d, formatX, formatY) -> , one value per line: String | Object: {style,css,txt}
default:
      formatLabel (bar, formatX, formatY) {
        return [
          'x: ' + formatX(bar.xv),
          'y: ' + formatY(bar.yv)
        ]
      },
bars: Boolean : show bars | Object:
curve: Boolean | Object:
type: String | Function
String, name of d3 curve Types ex: 'linearClosed' or 'curveLinearClosed' (default: MonotoneX) see d3-shape#curves
Fuction: custom curve function
style: Object: {css-prop: value}
gradient: Boolean | Object : { sroke:Boolean, fill:Boolean }
close: Boolean, close curve to chart limits
curveBack: render another curve, with same settings as default.
marks: Boolean | Object: {type: point | square style:{ fill , stroke }, size }
domain Object: {max:[number],min:[number] The domain values are auto calculated from data, but for example,if you want a chart that start from zero you can pass the domain option as: {min:0}
FAQs
Vue component to draw bar charts using d3
We found that vue-d3-barchart demonstrated a not healthy version release cadence and project activity because the last version was released a year ago. It has 1 open source maintainer collaborating on the project.
Did you know?

Socket for GitHub automatically highlights issues in each pull request and monitors the health of all your open source dependencies. Discover the contents of your packages and block harmful activity before you install or update your dependencies.

Security News
/Research
Malicious npm package impersonates Nodemailer and drains wallets by hijacking crypto transactions across multiple blockchains.

Security News
This episode explores the hard problem of reachability analysis, from static analysis limits to handling dynamic languages and massive dependency trees.

Security News
/Research
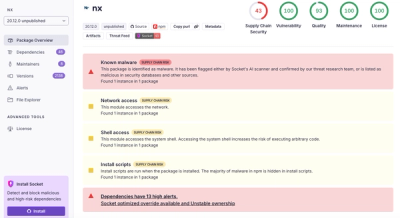
Malicious Nx npm versions stole secrets and wallet info using AI CLI tools; Socket’s AI scanner detected the supply chain attack and flagged the malware.