wrn-echarts
React Native version of Apache Echarts, based on react-native-svg and react-native-skia. Much better performance than webview based solution.
Checkout the full documentation here.
About
- 🔥 The same way as Apache ECharts
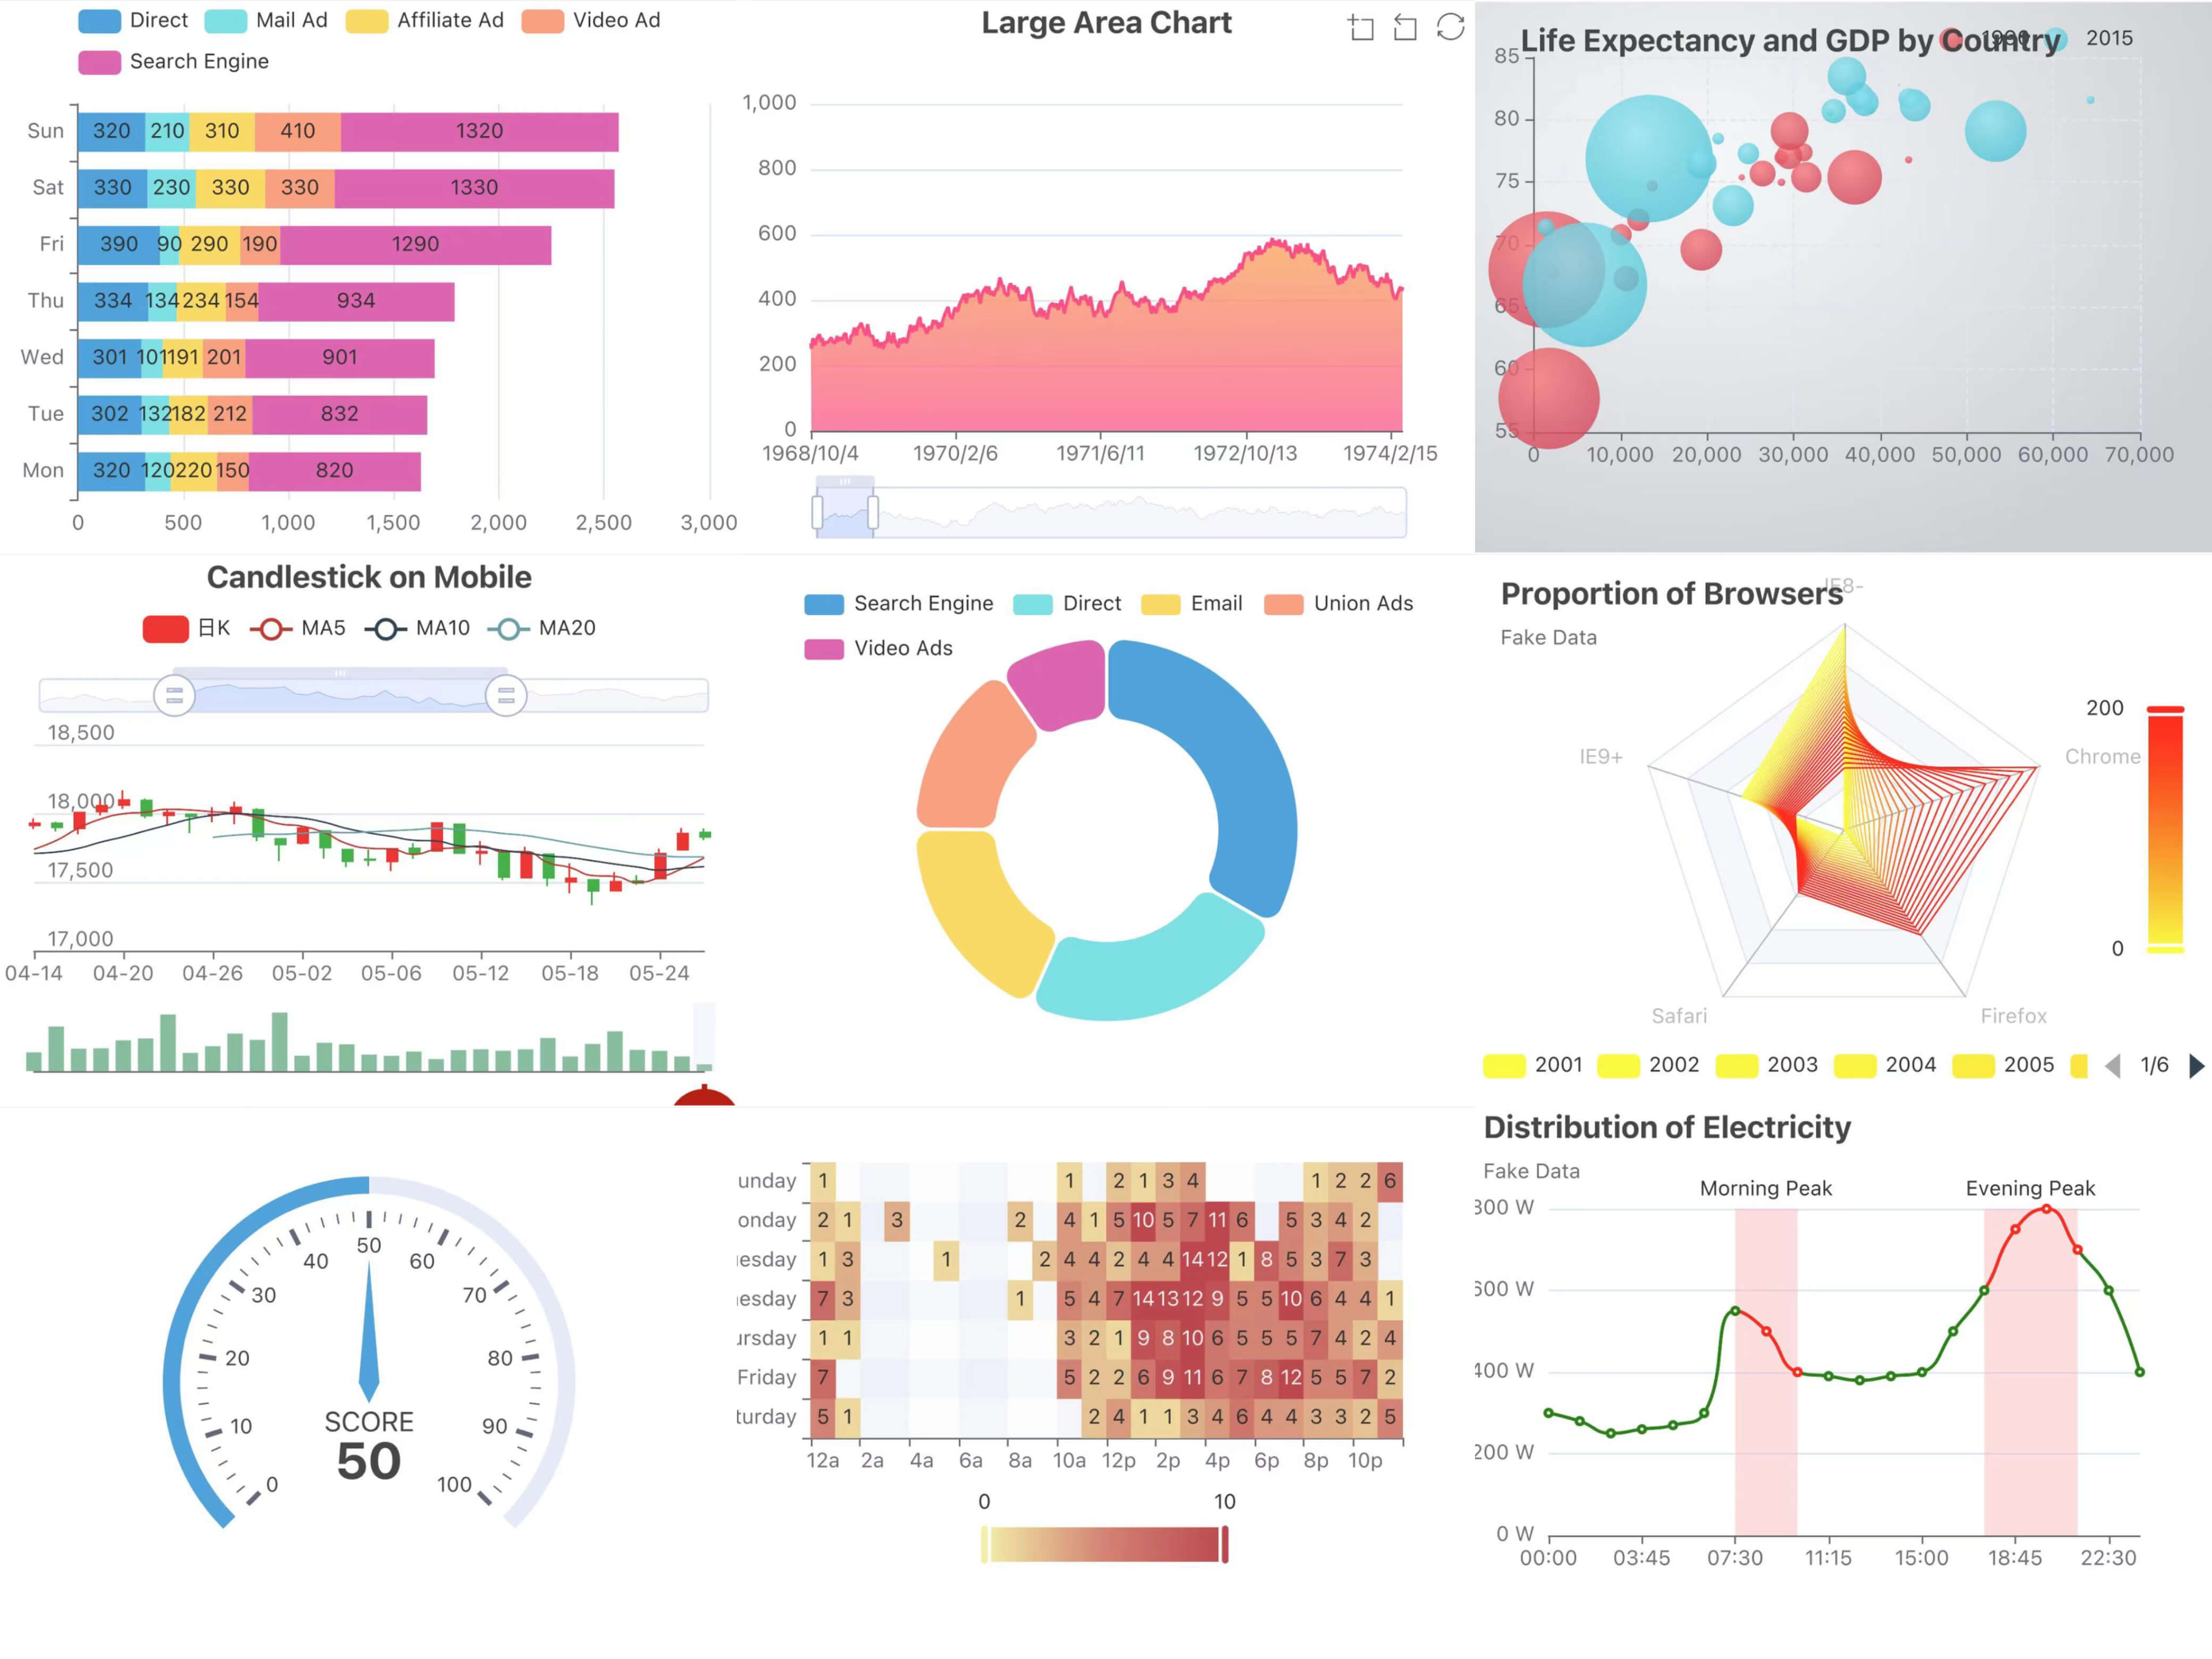
- 🎨 Rich charts, covering almost all usage scenarios
- ✨ Optional rendering library, Skia or SVG
- 🚀 Able to reuse code with web
- 📱 Support for zoom gestures
Installation
yarn add wrn-echarts echarts
Install react-native-svg or react-native-skia according to your needs.
The latest versions of echarts, react-native-svg and react-native-skia are recommended
Usage
Most of the charts in echarts are supported, and the usage remains largely consistent. For more use cases and demo previews, you can download the Taro Playground app.
Skia echarts
import SkiaChart, { SVGRenderer } from 'wrn-echarts/skiaChart';
import * as echarts from 'echarts/core';
import { useRef, useEffect } from 'react';
import {
BarChart,
} from 'echarts/charts';
import {
TitleComponent,
TooltipComponent,
GridComponent,
} from 'echarts/components';
echarts.use([
TitleComponent,
TooltipComponent,
GridComponent,
SVGRenderer,
BarChart,
])
const E_HEIGHT = 250;
const E_WIDTH = 300;
function SkiaComponent({ option }) {
const skiaRef = useRef<any>(null);
useEffect(() => {
let chart: any;
if (skiaRef.current) {
chart = echarts.init(skiaRef.current, 'light', {
renderer: 'svg',
width: E_WIDTH,
height: E_HEIGHT,
});
chart.setOption(option);
}
return () => chart?.dispose();
}, [option]);
return <SkiaChart ref={skiaRef} />;
}
export default function App() {
const option = {
xAxis: {
type: 'category',
data: ['Mon', 'Tue', 'Wed', 'Thu', 'Fri', 'Sat', 'Sun'],
},
yAxis: {
type: 'value',
},
series: [
{
data: [120, 200, 150, 80, 70, 110, 130],
type: 'bar',
},
],
}
return <SkiaComponent option={option} />
}
SVG echarts
import SvgChart, { SVGRenderer } from 'wrn-echarts/svgChart';
import * as echarts from 'echarts/core';
import { useRef, useEffect } from 'react';
import {
BarChart,
} from 'echarts/charts';
import {
TitleComponent,
TooltipComponent,
GridComponent,
} from 'echarts/components';
echarts.use([
TitleComponent,
TooltipComponent,
GridComponent,
SVGRenderer,
BarChart,
])
const E_HEIGHT = 250;
const E_WIDTH = 300;
function SvgComponent({ option }) {
const svgRef = useRef<any>(null);
useEffect(() => {
let chart: any;
if (svgRef.current) {
chart = echarts.init(svgRef.current, 'light', {
renderer: 'svg',
width: E_WIDTH,
height: E_HEIGHT,
});
chart.setOption(option);
}
return () => chart?.dispose();
}, [option]);
return <SvgChart ref={svgRef} />;
}
export default function App() {
const option = {
xAxis: {
type: 'category',
data: ['Mon', 'Tue', 'Wed', 'Thu', 'Fri', 'Sat', 'Sun'],
},
yAxis: {
type: 'value',
},
series: [
{
data: [120, 200, 150, 80, 70, 110, 130],
type: 'bar',
},
],
}
return <SvgComponent option={option} />
}
Use only one of SvgChart or SkiaChart
import SvgChart, { SVGRenderer } from 'wrn-echarts/svgChart';
or
import SkiaChart, { SVGRenderer } from 'wrn-echarts/skiaChart';
Contributing
See the contributing guide to learn how to contribute to the repository and the development workflow.
License
Apache-2.0
Made with create-react-native-library