

Research
Security News
The Growing Risk of Malicious Browser Extensions
Socket researchers uncover how browser extensions in trusted stores are used to hijack sessions, redirect traffic, and manipulate user behavior.
By Kush Pandya - Jun 13, 2025
![]()
![]()

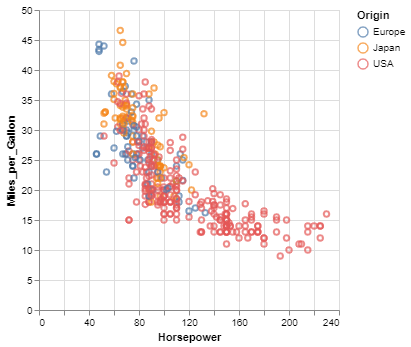
Vega-Altair is a declarative statistical visualization library for Python. With Vega-Altair, you can spend more time understanding your data and its meaning. Vega-Altair's API is simple, friendly and consistent and built on top of the powerful Vega-Lite JSON specification. This elegant simplicity produces beautiful and effective visualizations with a minimal amount of code.
Vega-Altair was originally developed by Jake Vanderplas and Brian Granger in close collaboration with the UW Interactive Data Lab. The Vega-Altair open source project is not affiliated with Altair Engineering, Inc.
See Vega-Altair's Documentation Site as well as the Tutorial Notebooks. You can run the notebooks directly in your browser by clicking on one of the following badges:
![]()
![]()
Here is an example using Vega-Altair to quickly visualize and display a dataset with the native Vega-Lite renderer in the JupyterLab:
import altair as alt

# load a simple dataset as a pandas DataFrame
from vega_datasets import data
cars = data.cars()

alt.Chart(cars).mark_point().encode(
    x='Horsepower',
    y='Miles_per_Gallon',
    color='Origin',
)
One of the unique features of Vega-Altair, inherited from Vega-Lite, is a declarative grammar of not just visualization, but interaction. With a few modifications to the example above we can create a linked histogram that is filtered based on a selection of the scatter plot.
import altair as alt
from vega_datasets import data

source = data.cars()

brush = alt.selection_interval()

points = alt.Chart(source).mark_point().encode(
    x='Horsepower',
    y='Miles_per_Gallon',
    color=alt.when(brush).then("Origin").otherwise(alt.value("lightgray"))
).add_params(
    brush
)

bars = alt.Chart(source).mark_bar().encode(
    y='Origin',
    color='Origin',
    x='count(Origin)'
).transform_filter(
    brush
)

points & bars
Vega-Altair can be installed with:
pip install altair
If you are using the conda package manager, the equivalent is:
conda install altair -c conda-forge
For full installation instructions, please see the documentation.
If you have a question that is not addressed in the documentation,
you can post it on StackOverflow using the altair tag.
For bugs and feature requests, please open a Github Issue.
![]()
You can find the instructions on how to install the package for development in the documentation.
To run the tests and linters, use
hatch test
For information on how to contribute your developments back to the Vega-Altair repository, see
CONTRIBUTING.md
If you use Vega-Altair in academic work, please consider citing https://joss.theoj.org/papers/10.21105/joss.01057 as
@article{VanderPlas2018,
    doi = {10.21105/joss.01057},
    url = {https://doi.org/10.21105/joss.01057},
    year = {2018},
    publisher = {The Open Journal},
    volume = {3},
    number = {32},
    pages = {1057},
    author = {Jacob VanderPlas and Brian Granger and Jeffrey Heer and Dominik Moritz and Kanit Wongsuphasawat and Arvind Satyanarayan and Eitan Lees and Ilia Timofeev and Ben Welsh and Scott Sievert},
    title = {Altair: Interactive Statistical Visualizations for Python},
    journal = {Journal of Open Source Software}
}
Please additionally consider citing the Vega-Lite project, which Vega-Altair is based on: https://dl.acm.org/doi/10.1109/TVCG.2016.2599030
@article{Satyanarayan2017,
    author={Satyanarayan, Arvind and Moritz, Dominik and Wongsuphasawat, Kanit and Heer, Jeffrey},
    title={Vega-Lite: A Grammar of Interactive Graphics},
    journal={IEEE transactions on visualization and computer graphics},
    year={2017},
    volume={23},
    number={1},
    pages={341-350},
    publisher={IEEE}
}
FAQs
Vega-Altair: A declarative statistical visualization library for Python.
We found that altair demonstrated a healthy version release cadence and project activity because the last version was released less than a year ago. It has 6 open source maintainers collaborating on the project.
Did you know?

Socket for GitHub automatically highlights issues in each pull request and monitors the health of all your open source dependencies. Discover the contents of your packages and block harmful activity before you install or update your dependencies.
Research
Security News
Socket researchers uncover how browser extensions in trusted stores are used to hijack sessions, redirect traffic, and manipulate user behavior.

Research
Security News
An in-depth analysis of credential stealers, crypto drainers, cryptojackers, and clipboard hijackers abusing open source package registries to compromise Web3 development environments.

Security News
pnpm 10.12.1 introduces a global virtual store for faster installs and new options for managing dependencies with version catalogs.