Research
/Security News
Critical Vulnerability in NestJS Devtools: Localhost RCE via Sandbox Escape
A flawed sandbox in @nestjs/devtools-integration lets attackers run code on your machine via CSRF, leading to full Remote Code Execution (RCE).
artefacts-toolkit-chart
Advanced tools
Please consider this as a pre-release package, and thus subject to large, and breaking, changes prior to v1
A part of the Artefacts Toolkit, this package contains helpers to be used when creating charts from test data
Primarily designed to be used with Artefacts, the package can also be used standalone.
from artefacts_toolkit_chart import make_chart
make_chart(
filepath,
topic_x,
topic_y,
field_unit=None,
output_dir="output",
chart_name="chart",
file_type="rosbag",
):
Note: Currently charts can only be created from rosbags
Takes a file and creates a chart on the provided two topics. "time" can also be used as topic_x or topic_y if desired. An html chart will be created and saved to the output_dir.
make_chart will use the rosbag’s own timestamps, which may cause timing inaccuracies if the rosbag was recorded or played back at non-real-time speeds.The Artefacts Toolkit also contains a bag_recorder helper to assist you if you require help in setting up a rosbag recording for your tests.
from artefacts_toolkit_rosbag.rosbag import get_bag_recorder
PYTHONPATHexport PYTHONPATH=$PYTHONPATH:/<your_workspace>/venv/lib/python3.10/site-packages
FAQs
Unknown package
We found that artefacts-toolkit-chart demonstrated a healthy version release cadence and project activity because the last version was released less than a year ago. It has 1 open source maintainer collaborating on the project.
Did you know?

Socket for GitHub automatically highlights issues in each pull request and monitors the health of all your open source dependencies. Discover the contents of your packages and block harmful activity before you install or update your dependencies.

Research
/Security News
A flawed sandbox in @nestjs/devtools-integration lets attackers run code on your machine via CSRF, leading to full Remote Code Execution (RCE).

Product
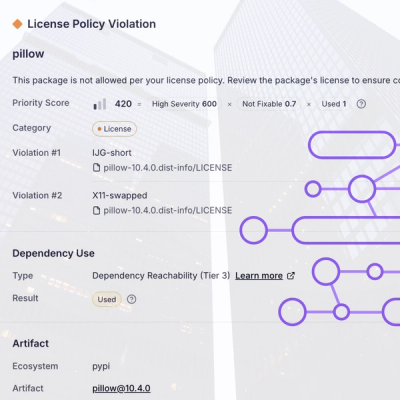
Customize license detection with Socket’s new license overlays: gain control, reduce noise, and handle edge cases with precision.

Product
Socket now supports Rust and Cargo, offering package search for all users and experimental SBOM generation for enterprise projects.