Research
/Security News
Critical Vulnerability in NestJS Devtools: Localhost RCE via Sandbox Escape
A flawed sandbox in @nestjs/devtools-integration lets attackers run code on your machine via CSRF, leading to full Remote Code Execution (RCE).
browser-history-analysis
Advanced tools
A Python package that analyzes and visualizes your browser history data with interactive charts and insights.
| Features Overview | Preview |
|---|---|
|
|
git clone https://github.com/arpy8/browser-history-analysis.git
cd browser-history-analysis
pip install -e .
pip install https://github.com/arpy8/browser-history-analysis/archive/main.zip
Command prompt:
pip install https://github.com/arpy8/browser-history-analysis/archive/main.zip && bha
Powershell:
pip install https://github.com/arpy8/browser-history-analysis/archive/main.zip ; bha
This will launch the web application in your default browser.
streamlitplotlypandasbrowser-historynumpyseabornmatplotliburllib3This tool only reads your local browser history files. No data is sent to external servers – everything runs locally on your machine.
Feel free to open issues and submit pull requests!
Arpit Sengar (@arpy8)
FAQs
A package to visualize your browser history :D
We found that browser-history-analysis demonstrated a healthy version release cadence and project activity because the last version was released less than a year ago. It has 1 open source maintainer collaborating on the project.
Did you know?

Socket for GitHub automatically highlights issues in each pull request and monitors the health of all your open source dependencies. Discover the contents of your packages and block harmful activity before you install or update your dependencies.

Research
/Security News
A flawed sandbox in @nestjs/devtools-integration lets attackers run code on your machine via CSRF, leading to full Remote Code Execution (RCE).

Product
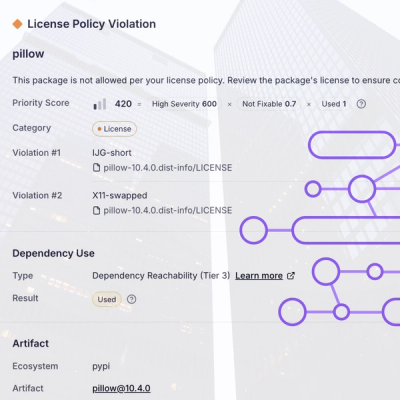
Customize license detection with Socket’s new license overlays: gain control, reduce noise, and handle edge cases with precision.

Product
Socket now supports Rust and Cargo, offering package search for all users and experimental SBOM generation for enterprise projects.