Security News
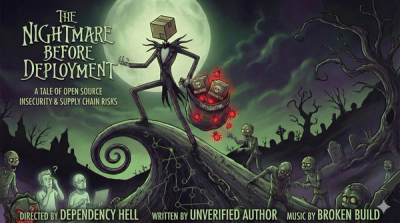
The Nightmare Before Deployment
Season’s greetings from Socket, and here’s to a calm end of year: clean dependencies, boring pipelines, no surprises.
By Ahmad Nassri - Dec 16, 2025
chartengineer
Advanced tools
chartengineer Documentationchartengineer is a lightweight Python package for building publication-ready, highly customizable Plotly charts from pandas DataFrames.
It supports a flexible API for pie charts, grouped bar charts, heatmaps, time series, and area/line plots, with robust formatting, annotations, and layout tools.
pip install chartengineer
Or install from source:
git clone https://github.com/BrandynHamilton/chartengineer
cd chartengineer
pip install -e .
from chartengineer import ChartMaker

cm = ChartMaker(shuffle_colors=True)
cm.build(
    df=my_df,
    groupby_col="CHAIN",
    num_col="TOTAL_VOLUME",
    title="Bridge Volume by Chain",
    chart_type="pie",
    options={
        "tickprefix": {"y1": "$"},
        "annotations": True,
        "texttemplate": "%{label}<br>%{percent}"
    }
)
cm.add_title(subtitle="As of 2025-04-01")
cm.show_fig()
"line" (default)"bar""area""pie""heatmap"You can use a string or dictionary:
chart_type = "bar"  # applies to both y1/y2
chart_type = {"y1": "line", "y2": "bar"}  # axis-specific
Check the tests directory for examples for each chart type.
ChartMaker.build(...)Build a chart.
Arguments
df: pandas DataFrametitle: Chart titlechart_type: string or dictgroupby_col, num_col: for grouped series or pie/baraxes_data: e.g. {"x": "DATE", "y1": ["TVL"]}options: plot style and behavior optionsChartMaker.show_fig()Render the current chart inline (Jupyter) or open in browser.
ChartMaker.save_fig(path, filetype='png')Save the chart as .png, .svg, or .html.
ChartMaker.add_title(title, subtitle, x, y)Adds a title to the chart itself, if title is None it defaults to the title name used in the build function. The X and Y parameters control the title's placement on the chart.
ChartMaker.add_annotations(max_annotation=True, custom_annotations=None, annotation_placement=dict(x=0.5,y=0.5))If called and the chart is plotting timeseries data, this automatically adds annotations for the first and last data points. If max_annotation is True, it dynamically calculates the max value in the dataset and annotates it. the custom_annotation parameter expects a dictionary with date as a string and the annotation text. Note that this is meant for plotting single-series timeseries data.
If the chart is a Pie chart, the annotation_placement parameter enables moving the location of where the annotation is placed.
ChartMaker.add_dashed_line(date, annotation_text=None)Adds a dashed line and annotation at the specified date; meant for timeseries data. If annotation_text is None, it uses the column name that contains the max value for the specified date.
ChartMaker.return_df()Returns the dataframe used in a chart.
ChartMaker.return_fig()Returns the Plotly figure that was created from calling the build method.
All style options can be passed via the options parameter when using ChartMaker. These options are merged with Plotly's base figure settings.
You can refer to:
options and their default values.Here’s a quick example:
options = {
    "tickprefix": {"y1": "$"},
    "ticksuffix": {"y1": "%"},
    "dimensions": {"width": 800, "height": 400},
    "font_family": "Cardo",
    "font_size": {"axes": 16, "legend": 12, "textfont": 12},
    "legend_placement": {"x": 1.05, "y": 1},
    "show_text": True,
    "annotations": True,
}
Email: brandynham1120@gmail.com
MIT License © Brandyn Hamilton
FAQs
Plotly and Pandas wrapper for quick and modern chart building.
We found that chartengineer demonstrated a healthy version release cadence and project activity because the last version was released less than a year ago. It has 1 open source maintainer collaborating on the project.
Did you know?

Socket for GitHub automatically highlights issues in each pull request and monitors the health of all your open source dependencies. Discover the contents of your packages and block harmful activity before you install or update your dependencies.
Security News
Season’s greetings from Socket, and here’s to a calm end of year: clean dependencies, boring pipelines, no surprises.

Research
/Security News
Impostor NuGet package Tracer.Fody.NLog typosquats Tracer.Fody and its author, using homoglyph tricks, and exfiltrates Stratis wallet JSON/passwords to a Russian IP address.

Security News
Deno 2.6 introduces deno audit with a new --socket flag that plugs directly into Socket to bring supply chain security checks into the Deno CLI.