crosstab


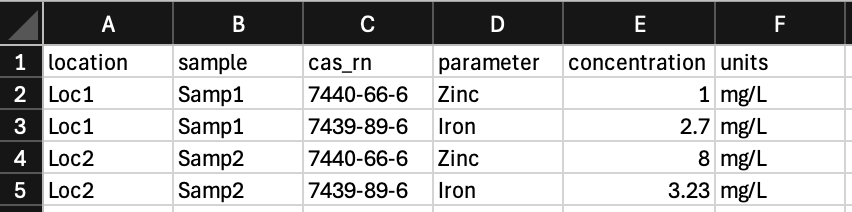
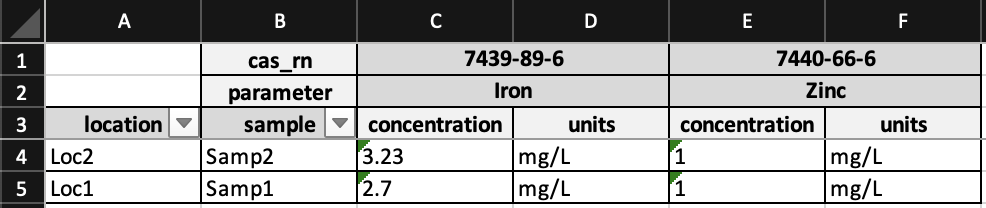
crosstab is a Python package that rearranges data from a normalized CSV format to a crosstabulated format, with styling.
Go from this:
To this:
Installation
You can install crosstab via pip from PyPI:
pip install crosstab
There is also a Docker image available on the GitHub Container Registry:
docker pull ghcr.io/geocoug/crosstab:latest
Usage
The following examples demonstrate how to use crosstab to crosstabulate a CSV file. By default, the output is an Excel file with two sheets: one that contains metadata about the crosstabulation (ie. who ran the script, when it was run, etc.) and another with the data crosstabulated. If the keep_sqlite parameter is set to True, the SQLite database used to store the source data is kept. The SQLite file will have the same basename as the input CSV file, but with a .sqlite extension. If the keep_src parameter is set to True, the source CSV data is copied to the Excel file as a third sheet.
Each of the examples below will produce the exact same output.
Python
from pathlib import Path

from crosstab import Crosstab

Crosstab(
    incsv=Path("data.csv"),
    outxlsx=Path("crosstabbed_data.xlsx"),
    row_headers=("location", "sample"),
    col_headers=("cas_rn", "parameter"),
    value_cols=("concentration", "units"),
    keep_sqlite=True,
    keep_src=True,
).crosstab()
Command Line
crosstab -k -s -f data.csv -o crosstabbed_data.xlsx -r location sample -c cas_rn parameter -v concentration units
Docker
docker run --rm -v $(pwd):/data ghcr.io/geocoug/crosstab:latest -k -s -f /data/data.csv -o /data/crosstabbed_data.xlsx -r location sample -c cas_rn parameter -v concentration units


