Security News
Crates.io Users Targeted by Phishing Emails
The Rust Security Response WG is warning of phishing emails from rustfoundation.dev targeting crates.io users.
csaps is a Python package for univariate, multivariate and n-dimensional grid data approximation using cubic smoothing splines. The package can be useful in practical engineering tasks for data approximation and smoothing.
Use pip for installing:
pip install -U csaps
or Poetry:
poetry add csaps
The module depends only on NumPy and SciPy. Python 3.10 or above is supported.
Here is a couple of examples of smoothing data.
An univariate data smoothing:
import numpy as np
import matplotlib.pyplot as plt

from csaps import csaps

np.random.seed(1234)

x = np.linspace(-5., 5., 25)
y = np.exp(-(x/2.5)**2) + (np.random.rand(25) - 0.2) * 0.3
xs = np.linspace(x[0], x[-1], 150)

ys = csaps(x, y, xs, smooth=0.85)

plt.plot(x, y, 'o', xs, ys, '-')
plt.show()

A surface data smoothing:
import numpy as np
import matplotlib.pyplot as plt
from mpl_toolkits.mplot3d import Axes3D

from csaps import csaps

np.random.seed(1234)
xdata = [np.linspace(-3, 3, 41), np.linspace(-3.5, 3.5, 31)]
i, j = np.meshgrid(*xdata, indexing='ij')
ydata = (3 * (1 - j)**2. * np.exp(-(j**2) - (i + 1)**2)
         - 10 * (j / 5 - j**3 - i**5) * np.exp(-j**2 - i**2)
         - 1 / 3 * np.exp(-(j + 1)**2 - i**2))
ydata = ydata + (np.random.randn(*ydata.shape) * 0.75)

ydata_s = csaps(xdata, ydata, xdata, smooth=0.988)

fig = plt.figure(figsize=(7, 4.5))
ax = fig.add_subplot(111, projection='3d')
ax.set_facecolor('none')
c = [s['color'] for s in plt.rcParams['axes.prop_cycle']]
ax.plot_wireframe(j, i, ydata, linewidths=0.5, color=c[0], alpha=0.5)
ax.scatter(j, i, ydata, s=10, c=c[0], alpha=0.5)
ax.plot_surface(j, i, ydata_s, color=c[1], linewidth=0, alpha=1.0)
ax.view_init(elev=9., azim=290)

plt.show()

More examples of usage and the full documentation can be found at https://csaps.readthedocs.io.
We use Poetry to manage the project:
git clone https://github.com/espdev/csaps.git
cd csaps
poetry install -E docs
Also, install pre-commit hooks:
poetry run pre-commit install
We use pytest for testing and ruff/mypy for linting.
Use poethepoet to run tests and linters:
poetry run poe test
poetry run poe check
csaps Python package is inspired by MATLAB CSAPS function that is an implementation of Fortran routine SMOOTH from PGS (originally written by Carl de Boor).
Also, the algothithm implementation in other languages:
C. de Boor, A Practical Guide to Splines, Springer-Verlag, 1978.
FAQs
Cubic spline approximation (smoothing)
We found that csaps demonstrated a healthy version release cadence and project activity because the last version was released less than a year ago. It has 1 open source maintainer collaborating on the project.
Did you know?

Socket for GitHub automatically highlights issues in each pull request and monitors the health of all your open source dependencies. Discover the contents of your packages and block harmful activity before you install or update your dependencies.

Security News
The Rust Security Response WG is warning of phishing emails from rustfoundation.dev targeting crates.io users.

Product
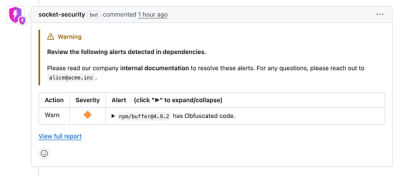
Socket now lets you customize pull request alert headers, helping security teams share clear guidance right in PRs to speed reviews and reduce back-and-forth.

Product
Socket's Rust support is moving to Beta: all users can scan Cargo projects and generate SBOMs, including Cargo.toml-only crates, with Rust-aware supply chain checks.