
Research
Malicious fezbox npm Package Steals Browser Passwords from Cookies via Innovative QR Code Steganographic Technique
A malicious package uses a QR code as steganography in an innovative technique.
By Olivia Brown - Sep 22, 2025
dash-oop-components
Advanced tools
dash_oop_componentsis a small helper library with object-oriented dashboard building blocks for the plotly dash library
pip install dash_oop_components
Documentation can be found at: https://oegedijk.github.io/dash_oop_components/
An example covid tracking dashboard has been deployed to dash-oop-demo.herokuapp.com (code at github.com/oegedijk/dash_oop_demo), showcasing:

Plotly's dash is an awesome library that allows you to build rich interactive data driven web apps with pure python code. However the default style of dash apps is quite declarative, which for large projects can lead to code that becomes unwieldy, hard to maintain, and hard to collaborate on:
This library provides a number object-oriented wrappers for organizing your dash code that allow you to write clean, modular, composable, re-usable and fully configurable dash code.
It includes:
DashFigureFactory: a wrapper for your data/plotting functionality, keeping data/plotting logic
seperate from your dashboard interaction logic.DashComponent: a self-contained, modular, configurable unit that combines a dash layout with dash callbacks.
DashFigureFactory for plots or other data outputDashComponents are composable, meaning that you can nest them into new composite components.DashConnectors to connect callbacks between componentsDashApp: Build a dashboard out of a DashComponent and run it.
DashComponentTabs you can also track state for current tab onlyAll wrappers:
Cool extras:
.yaml file,
including import details, and be fully reloaded from this config file.dashapp CLI!A full example dashboard can be found at github.com/oegedijk/dash_oop_demo and has been deployed to https://dash-oop-demo.herokuapp.com/
Below is the code for similar but slightly simpler example. Full explanation for the dash_oop_demo dashboard can be found in the example documentation.
The example is a rewrite of this Charming Data dash instruction video (go check out his other vids, they're awesome!).
First we define a basic DashFigureFactory that loads a covid dataset, and provides a single plotting functionality, namely plot_time_series(countries, metric). Make sure to call super().__init__() in order to store params to attributes (that's how the datafile parameters gets automatically assigned to self.datafile for example), and store them to a ._stored_params dict so that they can later be exported to a config file.
class CovidPlots(DashFigureFactory):
    def __init__(self, datafile="covid.csv"):
        super().__init__()
        self.df = pd.read_csv(self.datafile)

        self.countries = self.df.countriesAndTerritories.unique().tolist()
        self.metrics = ['cases', 'deaths']

    def plot_time_series(self, countries, metric):
        return px.line(
            data_frame=self.df[self.df.countriesAndTerritories.isin(countries)],
            x='dateRep',
            y=metric,
            color='countriesAndTerritories',
            labels={'countriesAndTerritories':'Countries', 'dateRep':'date'},
            )

figure_factory = CovidPlots("covid.csv")
print(figure_factory.to_yaml())
dash_figure_factory:
  class_name: CovidPlots
  module: __main__
  params:
    datafile: covid.csv
Then we define a DashComponent that takes a plot_factory and build a layout with two dropdowns and a graph.
The layout is defined in the layout(self, params=None) method
Callbacks are defined in the component_callbacks(self, app) method
By calling super().__init__() all parameters are automatically stored to attributes (so that we can access
e.g. self.hide_country_dropdown), and to a ._stored_params dict (which can then be exported to .yaml)
This layout makes use of the make_hideable() staticmethod, to conditionally
wrap certain layout elements in a hidden div.
We track the state of the dropdowns 'value' attribute by wrapping it in
self.querystring(params)(dcc.Dropdown)(..), and passing the urls's querystring params
down to the layout function upon pageload.
You can make sure that all component_id's are unique by adding +self.name. However if you use
self.id(component_id), then self.name gets automatically tagged on, and you can use
self.Input(), self.Output() and self.State() instead of the regular dash Input(),
Output() and State() functions.
name, gets a random uuid string automatically gets assigned.Note that the callbacks are registered using component_callbacks(self, app) method
Note that the callback uses the plot_factory for the plotting logic.
class CovidTimeSeries(DashComponent):
    def __init__(self, plot_factory,
                 hide_country_dropdown=False, countries=None,
                 hide_metric_dropdown=False, metric='cases', name=None):
        super().__init__()

        if not self.countries:
            self.countries = self.plot_factory.countries

    def layout(self, params=None):
        return dbc.Container([
            dbc.Row([
                dbc.Col([
                    html.H3("Covid Time Series"),
                    self.make_hideable(
                        self.querystring(params)(dcc.Dropdown)(
                            id=self.id('timeseries-metric-dropdown'),
                            options=[{'label': metric, 'value': metric} for metric in ['cases', 'deaths']],
                            value=self.metric,
                        ), hide=self.hide_metric_dropdown),
                    self.make_hideable(
                        self.querystring(params)(dcc.Dropdown)(
                            id=self.id('timeseries-country-dropdown'),
                            options=[{'label': country, 'value': country} for country in self.plot_factory.countries],
                            value=self.countries,
                            multi=True,
                        ), hide=self.hide_country_dropdown),
                    dcc.Graph(id=self.id('timeseries-figure'))
                ]),
            ])
        ])

    def component_callbacks(self, app):
        @app.callback(
            self.Output('timeseries-figure', 'figure'),
            self.Input('timeseries-country-dropdown', 'value'),
            self.Input('timeseries-metric-dropdown', 'value')
        )
        def update_timeseries_plot(countries, metric):
            if countries and metric is not None:
                return self.plot_factory.plot_time_series(countries, metric)
            raise PreventUpdate
A composite DashComponent that combines two CovidTimeSeries into a single layout.
Both subcomponents are passed the same plot_factory but assigned different initial values.
self.plot_left.layout(params) and self.plot_right.layout(params)self.component_callbacks(app)
.register_callbacks(app) first registers all callbacks of subcomponents,
and then calls component_callbacks(app).subcomponent.name fields in the ids.name="left" and name="right".class DuoPlots(DashComponent):
def __init__(self, plot_factory):
super().__init__()
self.plot_left = CovidTimeSeries(plot_factory,
countries=['China', 'Vietnam', 'Taiwan'],
metric='cases', name='left')
self.plot_right = CovidTimeSeries(plot_factory,
countries=['Italy', 'Germany', 'Sweden'],
metric='deaths', name='right')
def layout(self, params=None):
return dbc.Container([
html.H1("Covid Dashboard"),
dbc.Row([
dbc.Col([
self.plot_left.layout(params)
]),
dbc.Col([
self.plot_right.layout(params)
])
])
], fluid=True)
dashboard = DuoPlots(figure_factory)
print(dashboard.to_yaml())
dash_component:
  class_name: DuoPlots
  module: __main__
  params:
    plot_factory:
      dash_figure_factory:
        class_name: CovidPlots
        module: __main__
        params:
          datafile: covid.csv
    name: DAtVxQgozo
DashApp:Pass the dashboard to the DashApp to create a dash flask application.
mode='inline', 'external' or 'jupyterlab' when you are working in a notebook in order to keep
the notebook interactive while the app is runningquerystrings=True you automatically keep track of the state of the dashboard int the url querystringbootstrap=True the default bootstrap css gets automatically included. You can also choose particular themes, e.g. bootstrap=dbc.themes.FLATLY**kwargsapp = DashApp(dashboard, querystrings=True, bootstrap=True)
print(app.to_yaml())
dash_app:
  class_name: DashApp
  module: dash_oop_components.core
  params:
    dashboard_component:
      dash_component:
        class_name: DuoPlots
        module: __main__
        params:
          plot_factory:
            dash_figure_factory:
              class_name: CovidPlots
              module: __main__
              params:
                datafile: covid.csv
          name: DAtVxQgozo
    port: 8050
    mode: dash
    querystrings: true
    bootstrap: true
    kwargs:
      external_stylesheets:
      - https://stackpath.bootstrapcdn.com/bootstrap/4.5.0/css/bootstrap.min.css
      suppress_callback_exceptions: true
if run_app:
    app.run(9051)
app.to_yaml("covid_dashboard.yaml")
dashapp CLINow we could launch the dashboard from the command line with the dashapp CLI tool:
$ dashapp covid_dashboard.yaml
app2 = DashApp.from_yaml("covid_dashboard.yaml")
We can check that the configuration of this new app2 is indeed the same as app:
print(app2.to_yaml())
dash_app:
  class_name: DashApp
  module: dash_oop_components.core
  params:
    dashboard_component:
      dash_component:
        class_name: DuoPlots
        module: __main__
        params:
          plot_factory:
            dash_figure_factory:
              class_name: CovidPlots
              module: __main__
              params:
                datafile: covid.csv
          name: 95vGiZRAt2
    port: 8050
    mode: dash
    querystrings: true
    bootstrap: true
    kwargs:
      external_stylesheets:
      - https://stackpath.bootstrapcdn.com/bootstrap/4.5.0/css/bootstrap.min.css
      - https://stackpath.bootstrapcdn.com/bootstrap/4.5.0/css/bootstrap.min.css
      suppress_callback_exceptions: true
And if we run it it still works!
if run_app:
    app2.run()
FAQs
small library for OOP dashboard building blocks
We found that dash-oop-components demonstrated a healthy version release cadence and project activity because the last version was released less than a year ago. It has 1 open source maintainer collaborating on the project.
Did you know?

Socket for GitHub automatically highlights issues in each pull request and monitors the health of all your open source dependencies. Discover the contents of your packages and block harmful activity before you install or update your dependencies.
Research
A malicious package uses a QR code as steganography in an innovative technique.

Research
/Security News
Socket identified 80 fake candidates targeting engineering roles, including suspected North Korean operators, exposing the new reality of hiring as a security function.
Application Security
/Research
/Security News
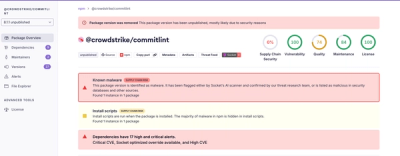
Socket detected multiple compromised CrowdStrike npm packages, continuing the "Shai-Hulud" supply chain attack that has now impacted nearly 500 packages.