Research
/Security News
Critical Vulnerability in NestJS Devtools: Localhost RCE via Sandbox Escape
A flawed sandbox in @nestjs/devtools-integration lets attackers run code on your machine via CSRF, leading to full Remote Code Execution (RCE).
DataProbe is a comprehensive Python toolkit for debugging, profiling, and optimizing data pipelines. It provides powerful tools to track data lineage, identify bottlenecks, monitor memory usage, and visualize pipeline execution flow with enterprise-grade visualizations.
DataProbe v1.0.0 introduces comprehensive pipeline debugging capabilities with professional-quality visualizations, intelligent optimization recommendations, advanced memory profiling, data lineage tracking, and enterprise-grade reporting.
# Generate enterprise dashboard
debugger.visualize_pipeline()
# Create 3D network visualization
debugger.create_3d_pipeline_visualization()
# Generate executive report
debugger.generate_executive_report()
pip install dataprobe
For development installation:
git clone https://github.com/santhoshkrishnan30/dataprobe.git
cd dataprobe
pip install -e ".[dev]"
from dataprobe import PipelineDebugger
import pandas as pd

# Initialize the debugger with enhanced features
debugger = PipelineDebugger(
    name="My_ETL_Pipeline",
    track_memory=True,
    track_lineage=True
)

# Use decorators to track operations
@debugger.track_operation("Load Data")
def load_data(file_path):
    return pd.read_csv(file_path)

@debugger.track_operation("Transform Data")
def transform_data(df):
    df['new_column'] = df['value'] * 2
    return df

# Run your pipeline
df = load_data("data.csv")
df = transform_data(df)

# Generate enterprise-grade visualizations
debugger.visualize_pipeline()              # Enterprise dashboard
debugger.create_3d_pipeline_visualization() # 3D network view
debugger.generate_executive_report()       # Executive report

# Get AI-powered optimization suggestions
suggestions = debugger.suggest_optimizations()
for suggestion in suggestions:
    print(f"💡 {suggestion['suggestion']}")

# Print summary and reports
debugger.print_summary()
report = debugger.generate_report()
@debugger.profile_memory
def memory_intensive_operation():
    large_df = pd.DataFrame(np.random.randn(1000000, 50))
    result = large_df.groupby(large_df.index % 1000).mean()
    return result
# Analyze DataFrames for potential issues
debugger.analyze_dataframe(df, name="Sales Data")
Professional KPI dashboard with real-time metrics, pipeline flowchart, memory analytics, and performance insights.
Pipeline Summary: My_ETL_Pipeline
├── Execution Statistics
│   ├── Total Operations: 5
│   ├── Total Duration: 2.34s
│   └── Total Memory Used: 125.6MB
├── Bottlenecks (1)
│   └── Transform Data: 1.52s
└── Memory Peaks (1)
    └── Load Large Dataset: +85.3MB
💡 OPTIMIZATION RECOMMENDATIONS:

1. [PERFORMANCE] Transform Data
   Issue: Operation took 1.52s
   💡 Consider optimizing this operation or parallelizing if possible

2. [MEMORY] Load Large Dataset
   Issue: High memory usage: +85.3MB
   💡 Consider processing data in chunks or optimizing memory usage
# Enterprise dashboard - Professional KPI dashboard
debugger.visualize_pipeline()

# 3D network visualization - Interactive operation relationships
debugger.create_3d_pipeline_visualization()

# Executive report - Multi-page stakeholder documentation
debugger.generate_executive_report()
# Export data lineage information
lineage_json = debugger.export_lineage(format="json")

# Track column changes automatically
@debugger.track_operation("Add Features")
def add_features(df):
    df['feature_1'] = df['value'].rolling(7).mean()
    df['feature_2'] = df['value'].shift(1)
    return df
@debugger.track_operation("Process Batch", batch_id=123, source="api")
def process_batch(data):
    # Operation metadata is stored and included in reports
    return processed_data
# Auto-save is enabled by default
debugger = PipelineDebugger(name="Pipeline", auto_save=True)

# Manual checkpoint
debugger.save_checkpoint()
debugger = PipelineDebugger(name="Pipeline", track_memory=False, track_lineage=False)
debugger = PipelineDebugger(name="Pipeline", memory_threshold_mb=500)
✅ Professional Styling: Modern design matching enterprise standards ✅ Executive Ready: Suitable for stakeholder presentations ✅ Performance Insights: AI-powered optimization recommendations ✅ Export Options: High-resolution PNG outputs ✅ Responsive Design: Scales from detailed debugging to executive overview ✅ Real-time Metrics: Live performance and memory tracking
Contributions are welcome! Please feel free to submit a Pull Request. For major changes, please open an issue first to discuss what you would like to change.
git checkout -b feature/AmazingFeature)git commit -m 'Add some AmazingFeature')git push origin feature/AmazingFeature)This project is licensed under the MIT License - see the LICENSE file for details.
Made with ❤️ by Santhosh Krishnan R
FAQs
Advanced data pipeline debugging and profiling tools for Python
We found that dataprobe demonstrated a healthy version release cadence and project activity because the last version was released less than a year ago. It has 1 open source maintainer collaborating on the project.
Did you know?

Socket for GitHub automatically highlights issues in each pull request and monitors the health of all your open source dependencies. Discover the contents of your packages and block harmful activity before you install or update your dependencies.

Research
/Security News
A flawed sandbox in @nestjs/devtools-integration lets attackers run code on your machine via CSRF, leading to full Remote Code Execution (RCE).

Product
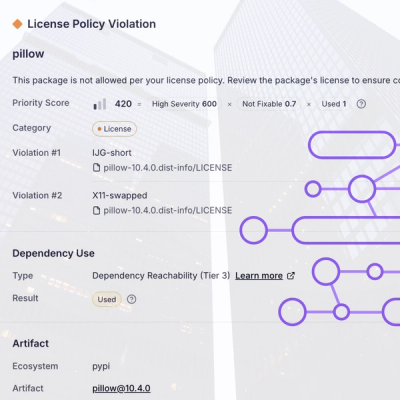
Customize license detection with Socket’s new license overlays: gain control, reduce noise, and handle edge cases with precision.

Product
Socket now supports Rust and Cargo, offering package search for all users and experimental SBOM generation for enterprise projects.