DataTour
datatour


DataTour
Seeing is important. datatour - allows you to see your data in its native dimension.
Currently implemented as a plotly scatter plot projected from its original dimension in the 2D on the screen with timeline animation inspired by GrandTour and common sense.
Installation
Available via pip:
pip install datatour
Usage
If you have array of feature vectors f: shape(shape)==(n_smpl, n_dim), you can create data tour object, and display it:
from datatour import DataTour as dt

ndv = dt(f)
ndv.display()
By default, selects randomly n_subsample=500 samples for efficiency reason.
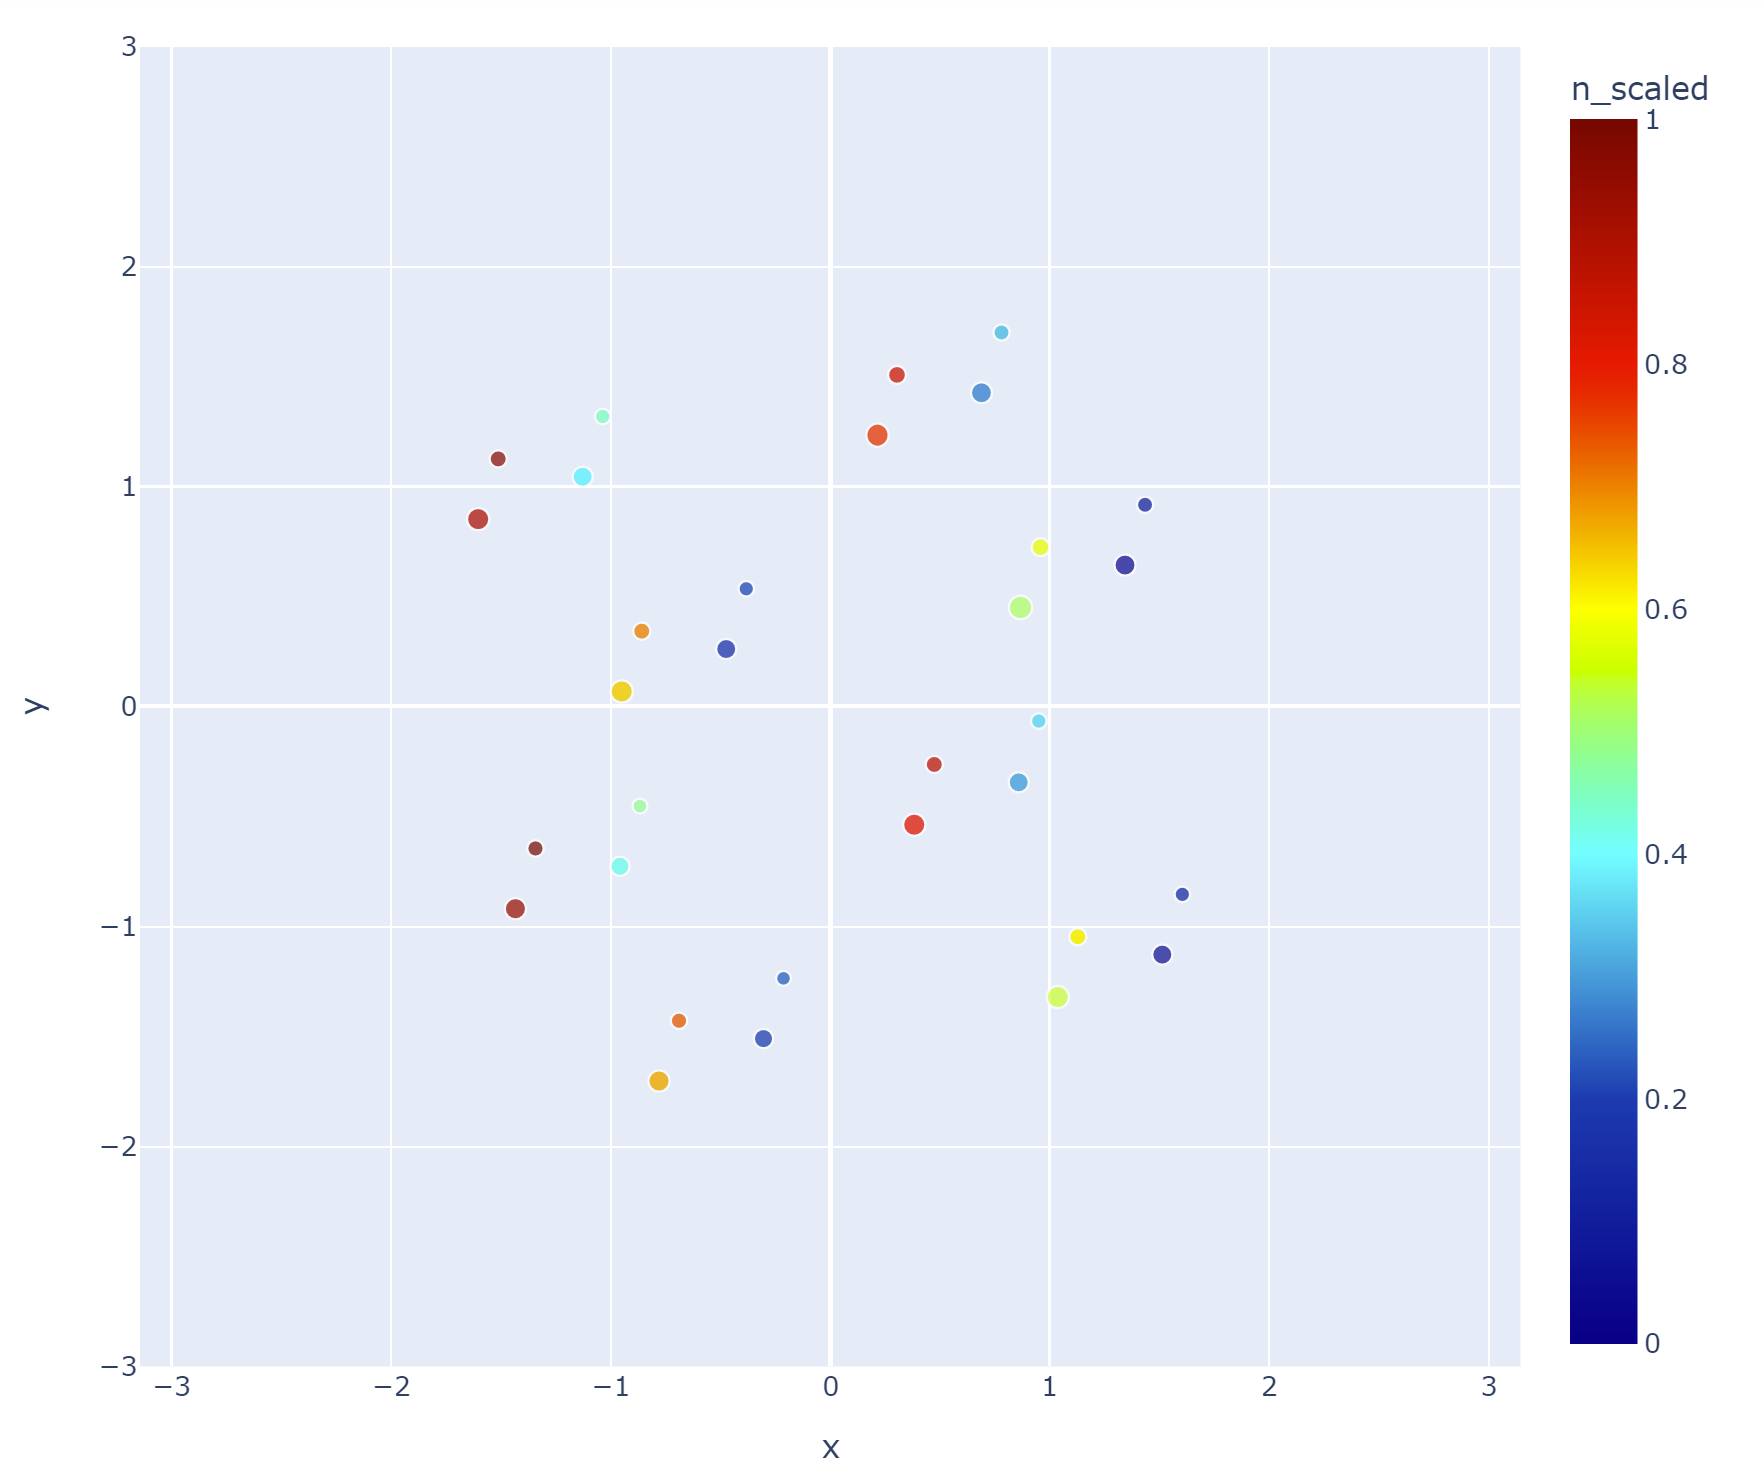
To visualize vector field vf of the same dimension (in the same feature space):
ndv = dt(f, vf)
ndv.display_quiver(color='z_scaled')
Also check examples:
dt().display()
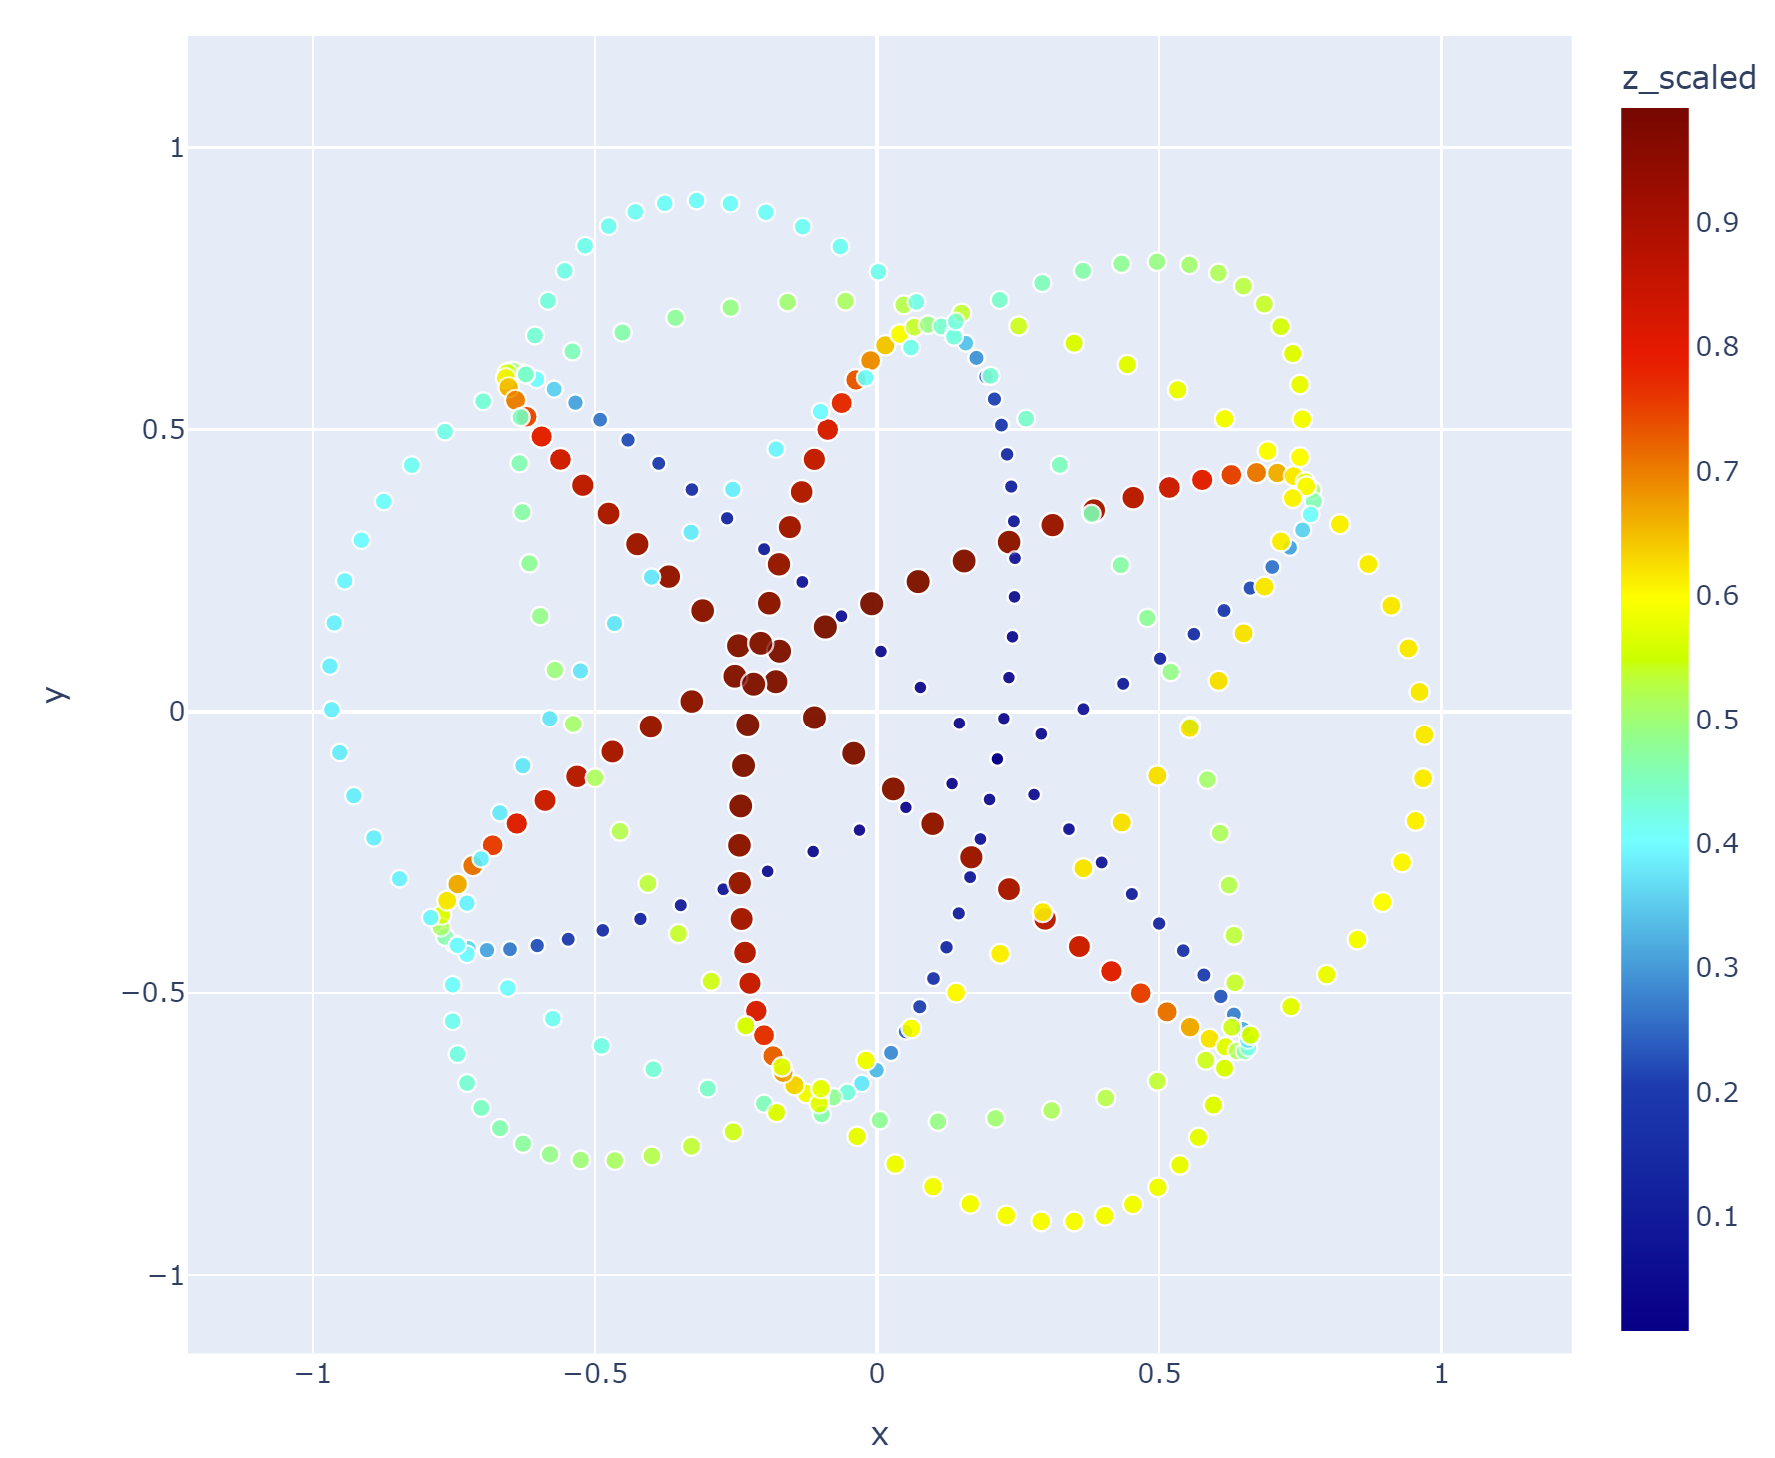
ndv = dt(example='sphere', n_subsample=0)
ndv.display(color='z_scaled')
Installation
Available via pip:
pip install datatour
Usage
If you have array of feature vectors f: shape(shape)==(n_smpl, n_dim), you can create data tour object, and display it:
from datatour import DataTour as dt

ndv = dt(f)
ndv.display()
By default, selects randomly n_subsample=500 samples for efficiency reason.
To visualize vector field vf of the same dimension (in the same feature space):
ndv = dt(f, vf)
ndv.display_quiver(color='z_scaled')
Also check examples:
dt().display()
ndv = dt(example='sphere', n_subsample=0)
ndv.display(color='z_scaled')
Licence
Distributed under BSD 3 licence
=======


