
Security News
New CVE Forecasting Tool Predicts 47,000 Disclosures in 2025
CVEForecast.org uses machine learning to project a record-breaking surge in vulnerability disclosures in 2025.
By Sarah Gooding - Jul 07, 2025
Django Chartjs ##############
Django Chartjs lets you manage charts in your Django application.
.. image:: https://travis-ci.org/peopledoc/django-chartjs.svg?branch=master :target: https://travis-ci.org/peopledoc/django-chartjs .. image:: https://coveralls.io/repos/peopledoc/django-chartjs/badge.png?branch=master&style=flat :target: https://coveralls.io/r/peopledoc/django-chartjs?branch=master .. image:: https://img.shields.io/pypi/v/django-chartjs.svg :target: https://pypi.python.org/pypi/django-chartjs/
This is compatible with Chart.js and Highcharts JS libraries.
Using a set of predefined Class Based Views you are able to get started after writing just your SQL query.
contributors <https://github.com/peopledoc/django-chartjs/graphs/contributors>_Install django-chartjs::
pip install django-chartjs
Add it to your INSTALLED_APPS settings::
INSTALLED_APPS = (
    '...',
    'chartjs',
)
A simple Line Chart example.
.. code-block:: html
{% load static %}
<html>
<head>
<title>django-chartjs line chart demo</title>
<!--[if lte IE 8]>
<script src="{% static 'js/excanvas.js' %}"></script>
<![endif]-->
</head>
<body>
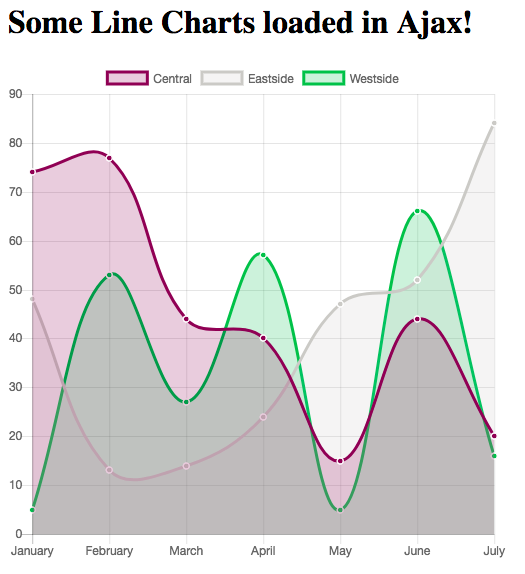
<h1>Some Line Charts loaded in Ajax!</h1>
<canvas id="myChart" width="500" height="400"></canvas>
<script type="text/javascript" src="http://code.jquery.com/jquery-1.10.0.min.js"></script>
<script type="text/javascript" src="{% static 'js/Chart.min.js' %}"></script>
<script type="text/javascript">
$.get('{% url "line_chart_json" %}', function(data) {
var ctx = $("#myChart").get(0).getContext("2d");
new Chart(ctx, {
type: 'line', data: data
});
});
</script>
</body>
</html>
2. Create the view with labels and data definition ++++++++++++++++++++++++++++++++++++++++++++++++++
.. code-block:: python
from django.views.generic import TemplateView
from chartjs.views.lines import BaseLineChartView


class LineChartJSONView(BaseLineChartView):
    def get_labels(self):
        """Return 7 labels for the x-axis."""
        return ["January", "February", "March", "April", "May", "June", "July"]

    def get_providers(self):
        """Return names of datasets."""
        return ["Central", "Eastside", "Westside"]

    def get_data(self):
        """Return 3 datasets to plot."""

        return [[75, 44, 92, 11, 44, 95, 35],
                [41, 92, 18, 3, 73, 87, 92],
                [87, 21, 94, 3, 90, 13, 65]]


line_chart = TemplateView.as_view(template_name='line_chart.html')
line_chart_json = LineChartJSONView.as_view()
3. Update urls.py with the new urls for TemplateView and AJAX call 'line_chart_json' as in chart.html +++++++++++++++++++++++++++++++++++++++++++++++++++++++++++++++++++++++++++++++++++++++++++++++++++++
.. code-block:: python
from .views import line_chart, line_chart_json

urlpatterns = [
  '...',
  path('chart', line_chart, name='line_chart'),
  path('chartJSON', line_chart_json, name='line_chart_json'),
]
4. Get a Chart.js Line Chart ++++++++++++++++++++++++++++
.. image:: https://raw.github.com/peopledoc/django-chartjs/master/docs/_static/django-chartjs.png
It is that simple!
For other examples including a HighCharts line chart, don't hesitate to look at the demo project.
Also, feel free to contribute your demo!
FAQs
Django Chart.js and Hightchart ajax views
We found that django-chartjs demonstrated a healthy version release cadence and project activity because the last version was released less than a year ago. It has 2 open source maintainers collaborating on the project.
Did you know?

Socket for GitHub automatically highlights issues in each pull request and monitors the health of all your open source dependencies. Discover the contents of your packages and block harmful activity before you install or update your dependencies.
Security News
CVEForecast.org uses machine learning to project a record-breaking surge in vulnerability disclosures in 2025.

Security News
Browserslist-rs now uses static data to reduce binary size by over 1MB, improving memory use and performance for Rust-based frontend tools.

Research
Security News
Eight new malicious Firefox extensions impersonate games, steal OAuth tokens, hijack sessions, and exploit browser permissions to spy on users.