Product
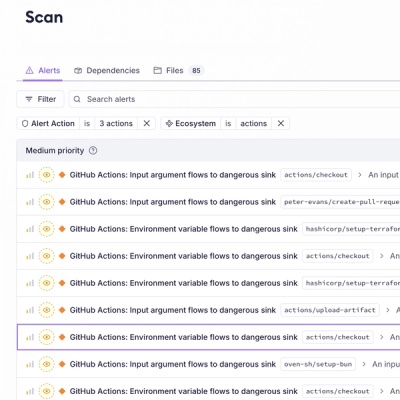
Introducing GitHub Actions Scanning Support
Detect malware, unsafe data flows, and license issues in GitHub Actions with Socket’s new workflow scanning support.
By Rakesh Chatrath, Greg Tystahl - Oct 23, 2025
Requirements
Step 1: import classes
# Convert data to pandas dataframe
from dpkits.ap_data_converter import APDataConverter
# Calculate LSM score
from dpkits.calculate_lsm import LSMCalculation
# Transpose data to stack and untack
from dpkits.data_transpose import DataTranspose
# Create the tables from converted dataframe
from dpkits.table_generator import DataTableGenerator
# Format data tables
from dpkits.table_formater import TableFormatter
Step 2: Convert data files to dataframe
# Define input/output files name
str_file_name = 'APDataTest'
str_tbl_file_name = f'{str_file_name}_Topline.xlsx'

converter = APDataConverter(file_name='APDataTesting.xlsx')

df_data, df_info = converter.convert_df_mc()

# Use 'converter.convert_df_md()' if you need md data
Step 3: Calculate LSM classificate (only for LSM projects)
df_data, df_info = LSMCalculation.cal_lsm_6(df_data, df_info)

# df_data, df_info will contains the columns CC1_Score to CC6_Score & LSM_Score
Step 4: Data cleaning (if needed)
# Use pandas's functions to clean/process data

df_data['Gender_new'] = df_data['Gender']

df_data.replace({
    'Q1_SP1': {1: 5, 2: 4, 3: 3, 4: 2, 5: 1},
    'Q1_SP2': {1: 5, 2: 4, 3: 3, 4: 2, 5: 1},
}, inplace=True)

df_data.loc[(df_data['Gender_new'] == 2) & (df_data['Age'] == 5),  ['Gender_new']] = [np.nan]
df_info.loc[df_info['var_name'] == 'Q1_SP1', ['val_lbl']] = [{'1': 'a', '2': 'b', '3': 'c', '4': 'd', '5': 'e'}]

df_info = pd.concat([df_info, pd.DataFrame(
    columns=['var_name', 'var_lbl', 'var_type', 'val_lbl'],
    data=[
        ['Gender_new', 'Please indicate your gender', 'SA', {'1': 'aaa', '2': 'bb', '3': 'cc'}]
    ]
)], ignore_index=True)
Step 5: Transpose data (if needed)
dict_stack_structure = {
    'id_col': 'ResID',
    'sp_col': 'Ma_SP',
    'lst_scr': ['Gender', 'Age', 'City', 'HHI'],
    'dict_sp': {
        1: {
            'Ma_SP1': 'Ma_SP',
            'Q1_SP1': 'Q1',
            'Q2_SP1': 'Q2',
            'Q3_SP1': 'Q3',
        },
        2: {
            'Ma_SP2': 'Ma_SP',
            'Q1_SP2': 'Q1',
            'Q2_SP2': 'Q2',
            'Q3_SP2': 'Q3',
        },
    },
    'lst_fc': ['Awareness1', 'Frequency', 'Awareness2', 'Perception']
}

df_data_stack, df_info_stack = DataTranspose.to_stack(df_data, df_info, dict_stack_structure)
dict_unstack_structure = {
    'id_col': 'ResID',
    'sp_col': 'Ma_SP',
    'lst_col_part_head': ['Gender', 'Age', 'City', 'HHI'],
    'lst_col_part_body': ['Q1', 'Q2', 'Q3'],
    'lst_col_part_tail': ['Awareness1', 'Frequency', 'Awareness2', 'Perception']
}

df_data_unstack, df_info_unstack = DataTranspose.to_unstack(df_data_stack, df_info_stack, dict_unstack_structure)
Step 6: OE Running
Step 7: Export *.sav & *.xlsx
dict_dfs = {
    1: {
        'data': df_data,
        'info': df_info,
        'tail_name': 'ByCode',
        'sheet_name': 'ByCode',
        'is_recode_to_lbl': False,
    },
    2: {
        'data': df_data,
        'info': df_info,
        'tail_name': 'ByLabel',
        'sheet_name': 'ByLabel',
        'is_recode_to_lbl': True,
    },
    3: {
        'data': df_data_stack,
        'info': df_info_stack,
        'tail_name': 'Stack',
        'sheet_name': 'Stack',
        'is_recode_to_lbl': False,
    },
    4: {
        'data': df_data_unstack,
        'info': df_info_unstack,
        'tail_name': 'Unstack',
        'sheet_name': 'Unstack',
        'is_recode_to_lbl': False,
    },
}

converter.generate_multiple_data_files(dict_dfs=dict_dfs, is_md=False, is_export_sav=True, is_export_xlsx=True, is_zip=True)
Step 8: Export data tables
lst_side_qres = [
    {"qre_name": "CC1", "sort": "des"},
    {"qre_name": "$CC3", "sort": "asc"},
    {"qre_name": "$CC4", "sort": "des"},
    {"qre_name": "$CC6"},
    {"qre_name": "$CC10"},
    {"qre_name": "LSM"},
    {"qre_name": "Gender"},
    {"qre_name": "Age"},
    {"qre_name": "City"},
    {"qre_name": "HHI"},

    # MA Question with net/combine (can apply to SA questions)
    {"qre_name": "$Q15", "cats": {
        'net_code': {
            '900001|combine|Group 1 + 2': {
                '1': 'Yellow/dull teeth',
                '3': 'Dental plaque',
                '5': 'Bad breath',
                '7': 'Aphthousulcer',
                '2': 'Sensitive teeth',
                '4': 'Caries',
                '6': 'Gingivitis (bleeding, swollen gums)',
            },
            '900002|net|Group 1': {
                '1': 'Yellow/dull teeth',
                '3': 'Dental plaque',
                '5': 'Bad breath',
                '7': 'Aphthousulcer',
            },
            '900003|net|Group 2': {
                '2': 'Sensitive teeth',
                '4': 'Caries',
                '6': 'Gingivitis (bleeding, swollen gums)',
            },
        },
        '8': 'Other (specify)',
        '9': 'No problem',
    }},

    # Scale question with full properties
    {
        "qre_name": "Perception",
        "cats": {
            '1': 'Totally disagree', '2': 'Disagree', '3': 'Neutral', '4': 'Agree', '5': 'Totally agree',
            'net_code': {
                '900001|combine|B2B': {'1': 'Totally disagree', '2': 'Disagree'},
                '900002|combine|Medium': {'3': 'Neutral'},
                '900003|combine|T2B': {'4': 'Agree', '5': 'Totally agree'},
            }
        },
        "mean": {1: 1, 2: 2, 3: 3, 4: 4, 5: 5}
    },
]

lst_header_qres = [
    [
        {
            "qre_name": "Age",
            "qre_lbl": "Age",
            "cats": {
                'TOTAL': 'TOTAL',
                '2': '18 - 24', '3': '25 - 30', '4': '31 - 39', '5': '40 - 50', '6': 'Trên 50'
            }
        },
        {
            "qre_name": "@City2",
            "qre_lbl": "Location",
            "cats": {
                'City.isin([1, 5, 10, 11, 12])': 'All South',
                'City.isin([2, 4, 16, 17, 18])': 'All North',
            }
        },
    ],
]

lst_func_to_run = [
    {
        'func_name': 'run_standard_table_sig',
        'tables_to_run': [
            'Tbl_1_Pct',  # this table use df_data & df_info to run
            'Tbl_1_Count',  # this table use df_data & df_info to run
        ],
        'tables_format': {

            "Tbl_1_Pct": {
                "tbl_name": "Table 1 - Pct",
                "tbl_filter": "City > 0",
                "is_count": 0,
                "is_pct_sign": 1,
                "is_hide_oe_zero_cats": 1,
                "sig_test_info": {
                    "sig_type": "",  # ind / rel
                    "sig_cols": [],
                    "lst_sig_lvl": []
                },
                "lst_side_qres": lst_side_qres,
                "lst_header_qres": lst_header_qres
            },

            "Tbl_1_Count": {
                "tbl_name": "Table 1 - Count",
                "tbl_filter": "City > 0",
                "is_count": 1,
                "is_pct_sign": 0,
                "is_hide_oe_zero_cats": 1,
                "sig_test_info": {
                    "sig_type": "",
                    "sig_cols": [],
                    "lst_sig_lvl": []
                },
                "lst_side_qres": lst_side_qres,
                "lst_header_qres": lst_header_qres
            },
        },

    },
]

dtg = DataTableGenerator(df_data=df_data, df_info=df_info, xlsx_name=str_tbl_file_name)
dtg.run_tables_by_js_files(lst_func_to_run)

dtf = TableFormatter(xlsx_name=str_tbl_file_name)
dtf.format_sig_table()
This is a simple example package. You can use Github-flavored Markdown to write your content.
FAQs
A small package for data processing
We found that dpkits demonstrated a healthy version release cadence and project activity because the last version was released less than a year ago. It has 1 open source maintainer collaborating on the project.
Did you know?

Socket for GitHub automatically highlights issues in each pull request and monitors the health of all your open source dependencies. Discover the contents of your packages and block harmful activity before you install or update your dependencies.
Product
Detect malware, unsafe data flows, and license issues in GitHub Actions with Socket’s new workflow scanning support.

Product
Add real-time Socket webhook events to your workflows to automatically receive pull request scan results and security alerts in real time.

Research
The Socket Threat Research Team uncovered malicious NuGet packages typosquatting the popular Nethereum project to steal wallet keys.