.. _matplotlib: https://matplotlib.org/
.. _fc-matplotlib4mesh: http://www.math.univ-paris13.fr/~cuvelier/software/Python/fc-matplotlib4mesh.html
.. _fc-meshtools: http://www.math.univ-paris13.fr/~cuvelier/software/Python/fc-meshtools.html
.. image:: http://www.math.univ-paris13.fr/~cuvelier/software/codes/Python/fc-matplotlib4mesh/pyfc-matplotlib4mesh_400.png
:width: 200px
:align: left
The fc_matplotlib4mesh Python package allows to display simplicial meshes or datas on simplicial meshes by using matplotlib_ (>= 2.0.0).
The simplicial meshes must be given by two arrays : the vertices array and the connectivity array.
Introduction:
Simplicial meshes could be:
- a triangular mesh in dimension 2, made with 2-simplices (ie. triangles),
- a tetrahedral mesh in dimension 3, made with 3-simplices (ie. tetrahedron),
- a triangular mesh in dimension 3 (surface mesh), made with 2-simplices,
- a line mesh in dimension 2 or 3 made with 1-simplices (ie. lines).
A simplicial mesh is given by its vertices array q and its connectivity array me
For demonstration purpose, some simplicial meshes are given in this package. They can be load
by using the function getMesh2D, getMesh3D or getMesh3Ds
of the fc_meshtools package.
Documentation is available on fc-matplotlib4mesh_ dedicated web page.
Installation:
The fc_matplotlib4mesh Python package is available from the Python Package Index, so to install/upgrade simply type
.. code::
pip install fc_matplotlib4mesh -U
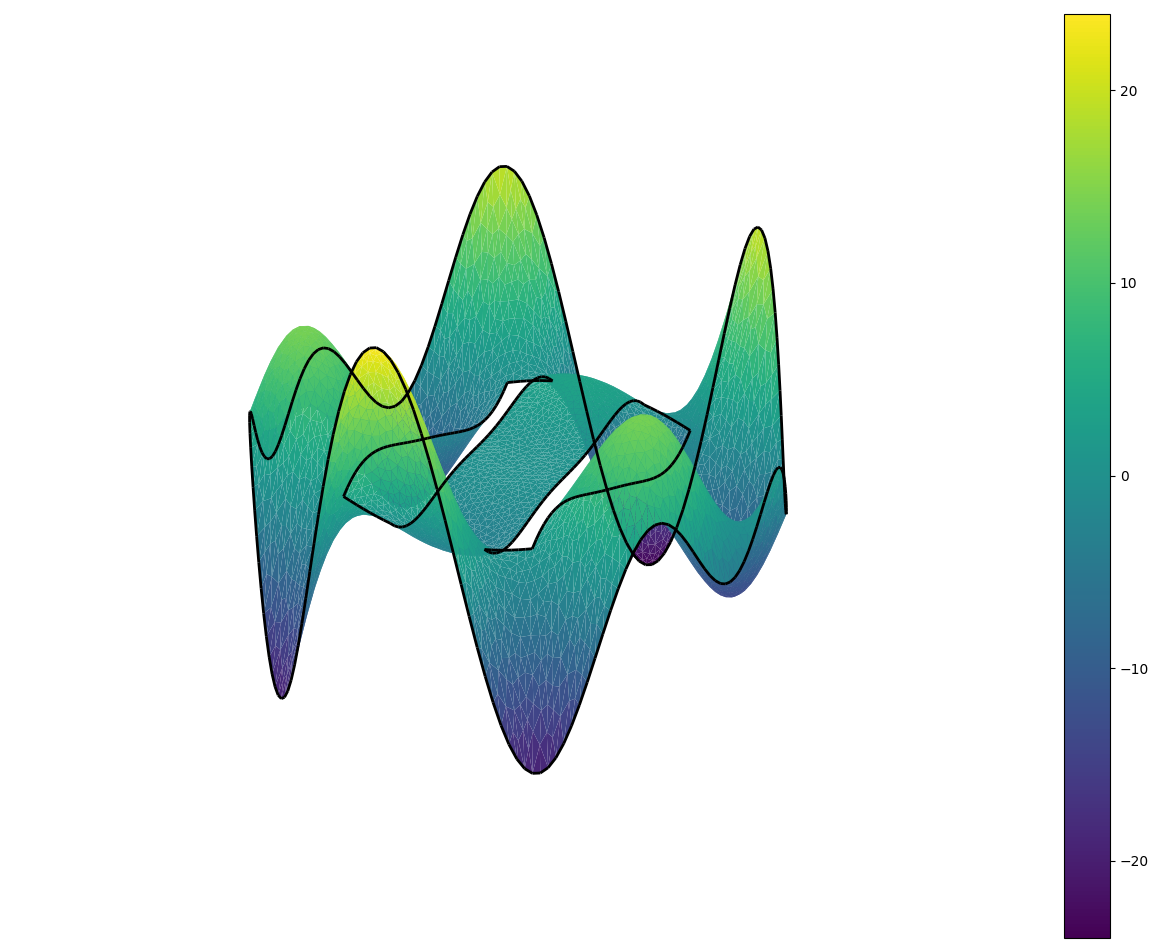
Thereafter, it's possible to run one of the demo functions
.. code:: python
import fc_matplotlib4mesh
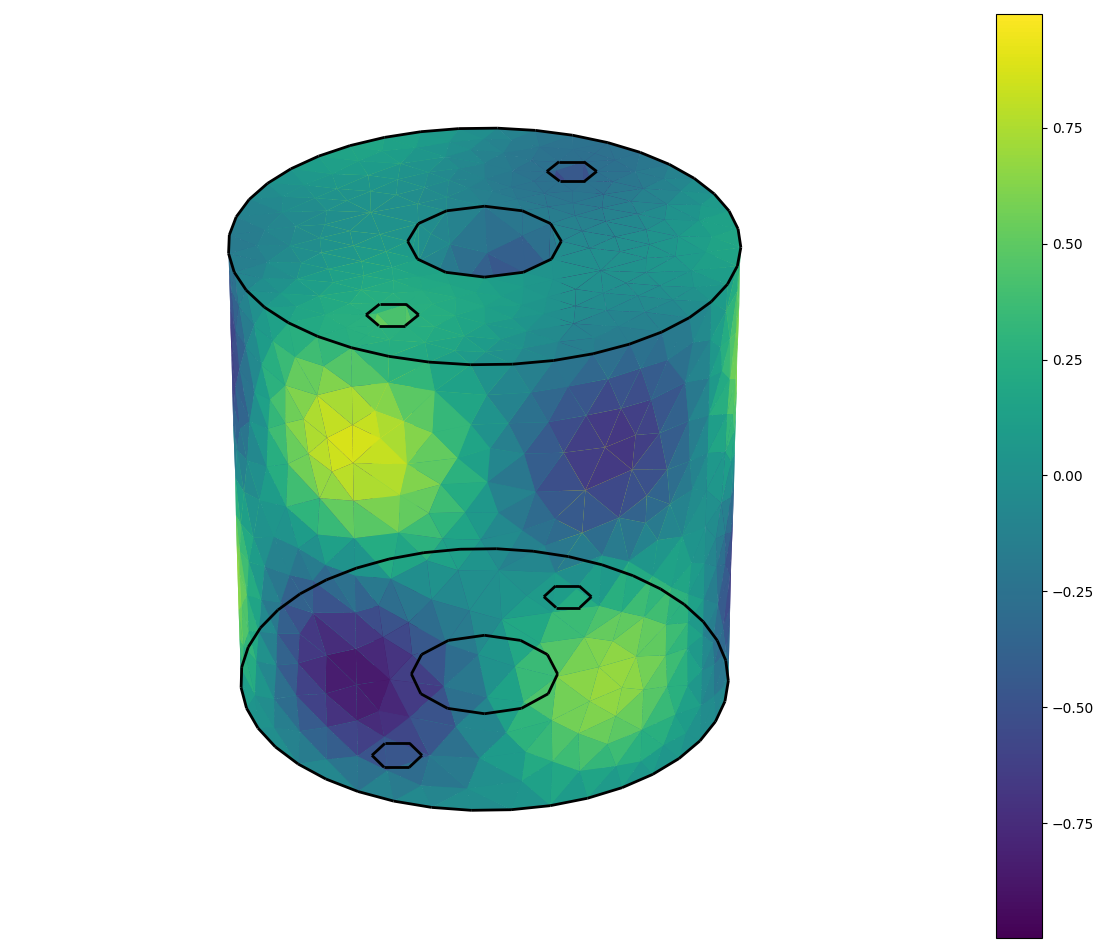
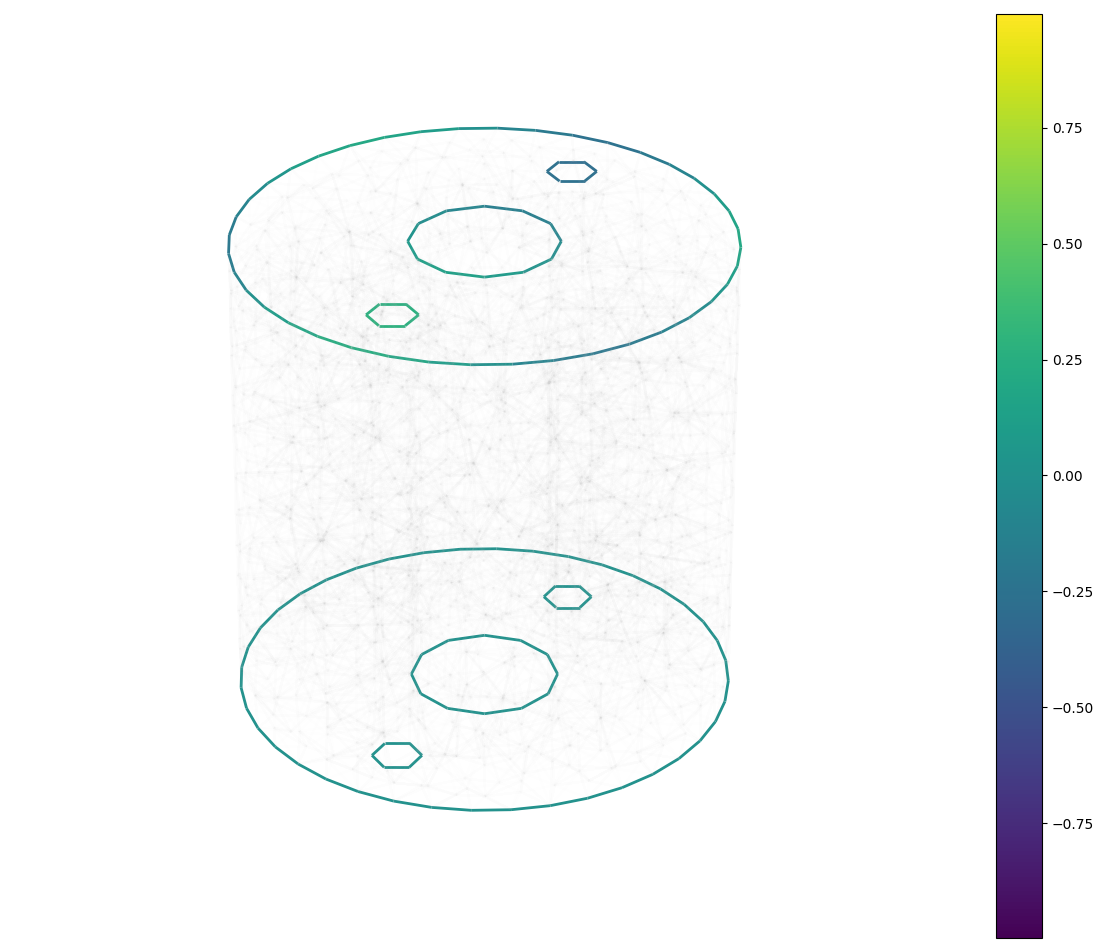
fc_matplotlib4mesh.demos.plot3D()
.. |plot3D_fig1| image:: http://www.math.univ-paris13.fr/~cuvelier/software/codes/Python/fc-matplotlib4mesh/snapshots/matplotlib4mesh_plot3D_fig1.png
:width: 300
:align: middle
.. |plot3D_fig2| image:: http://www.math.univ-paris13.fr/~cuvelier/software/codes/Python/fc-matplotlib4mesh/snapshots/matplotlib4mesh_plot3D_fig2.png
:width: 300
:align: middle
.. |plot3D_fig3| image:: http://www.math.univ-paris13.fr/~cuvelier/software/codes/Python/fc-matplotlib4mesh/snapshots/matplotlib4mesh_plot3D_fig3.png
:width: 300
:align: middle
+---------------+---------------+---------------+
| |plot3D_fig1| | |plot3D_fig2| | |plot3D_fig3| |
+---------------+---------------+---------------+
.. code:: python
import fc_matplotlib4mesh
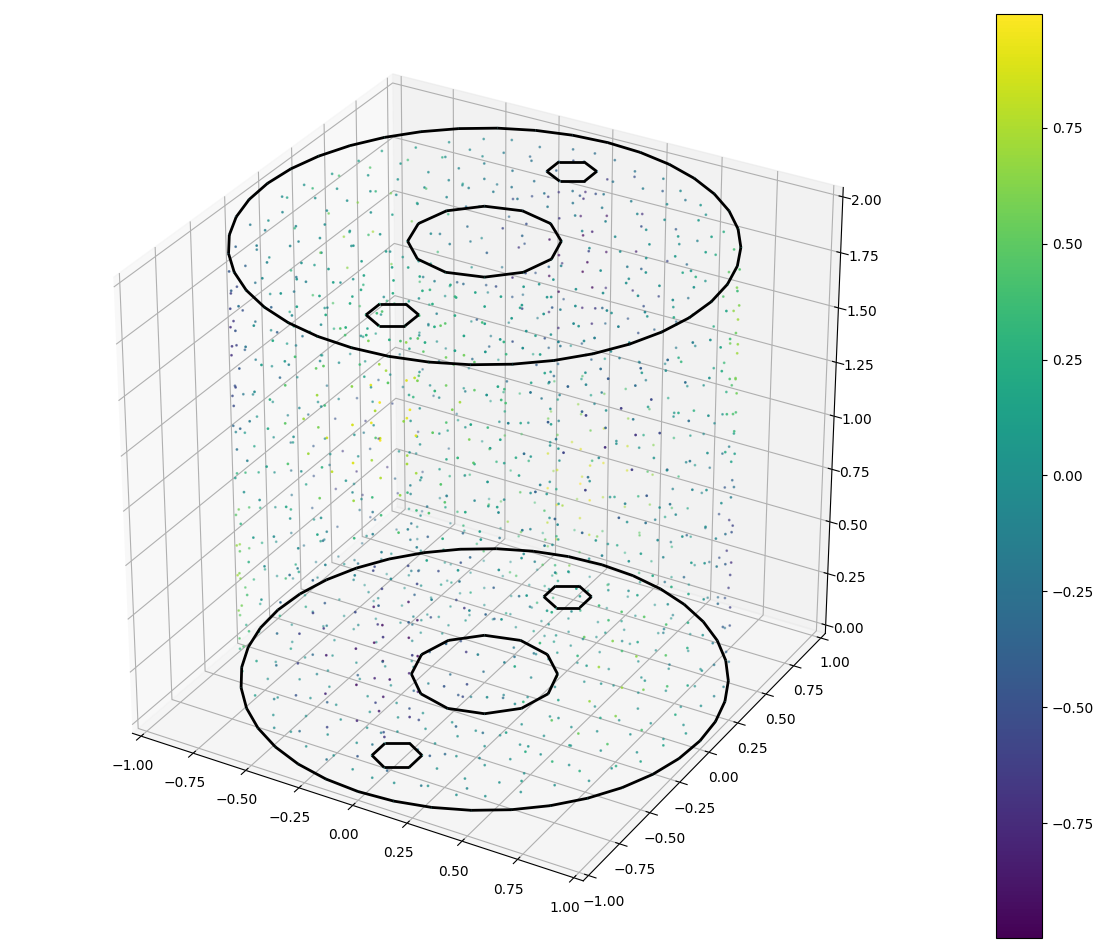
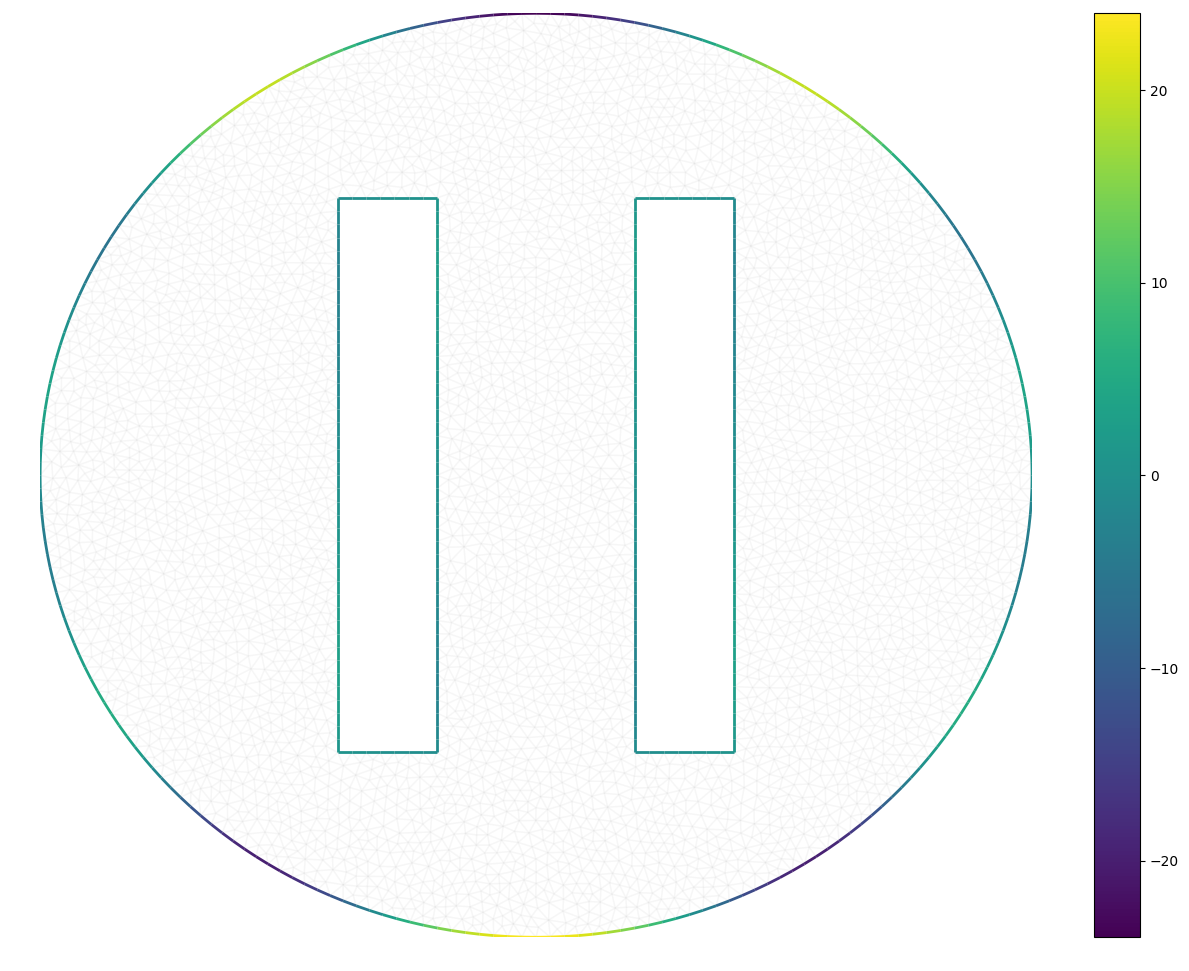
fc_matplotlib4mesh.demos.plot2D()
.. |plot2D_fig1| image:: http://www.math.univ-paris13.fr/~cuvelier/software/codes/Python/fc-matplotlib4mesh/snapshots/matplotlib4mesh_plot2D_fig1.png
:width: 300
:align: middle
.. |plot2D_fig2| image:: http://www.math.univ-paris13.fr/~cuvelier/software/codes/Python/fc-matplotlib4mesh/snapshots/matplotlib4mesh_plot2D_fig2.png
:width: 300
:align: middle
.. |plot2D_fig3| image:: http://www.math.univ-paris13.fr/~cuvelier/software/codes/Python/fc-matplotlib4mesh/snapshots/matplotlib4mesh_plot2D_fig3.png
:width: 300
:align: middle
+---------------+---------------+---------------+
| |plot2D_fig1| | |plot2D_fig2| | |plot2D_fig3| |
+---------------+---------------+---------------+
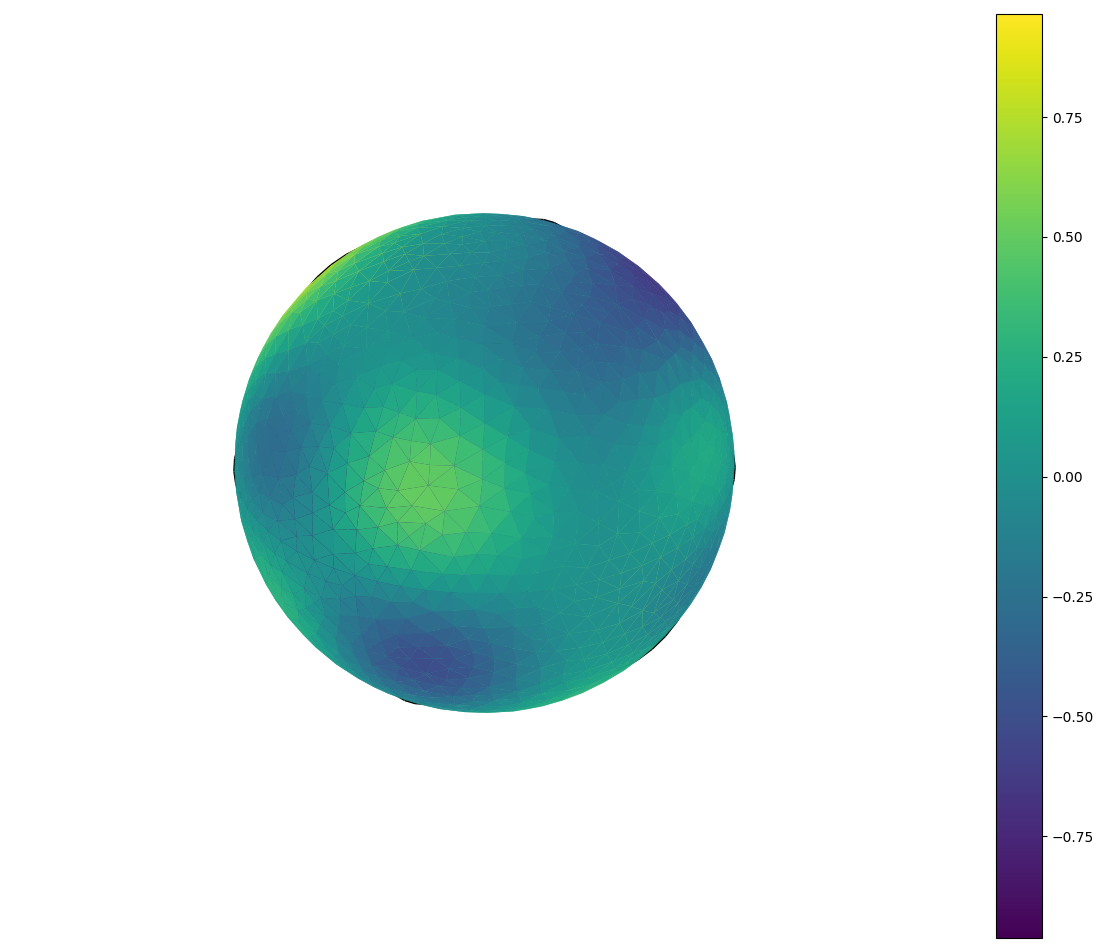
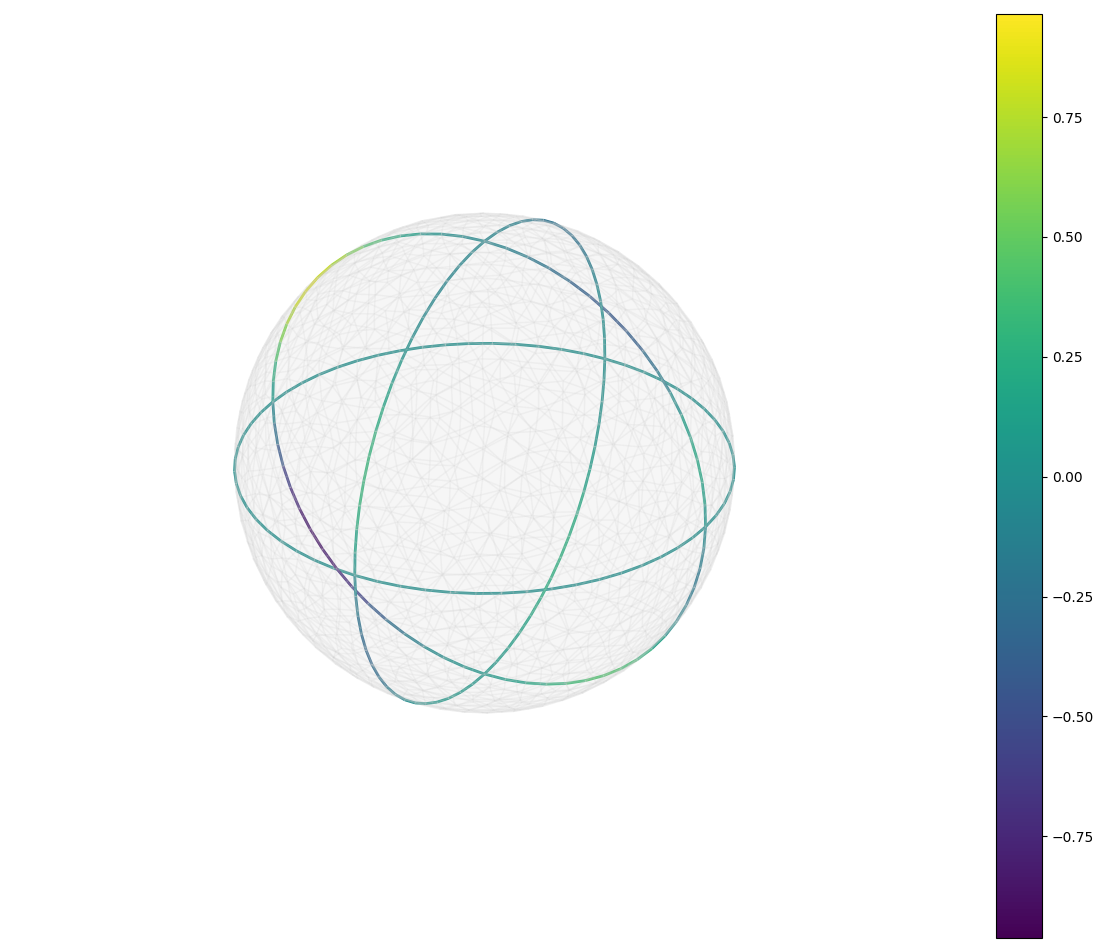
Example:
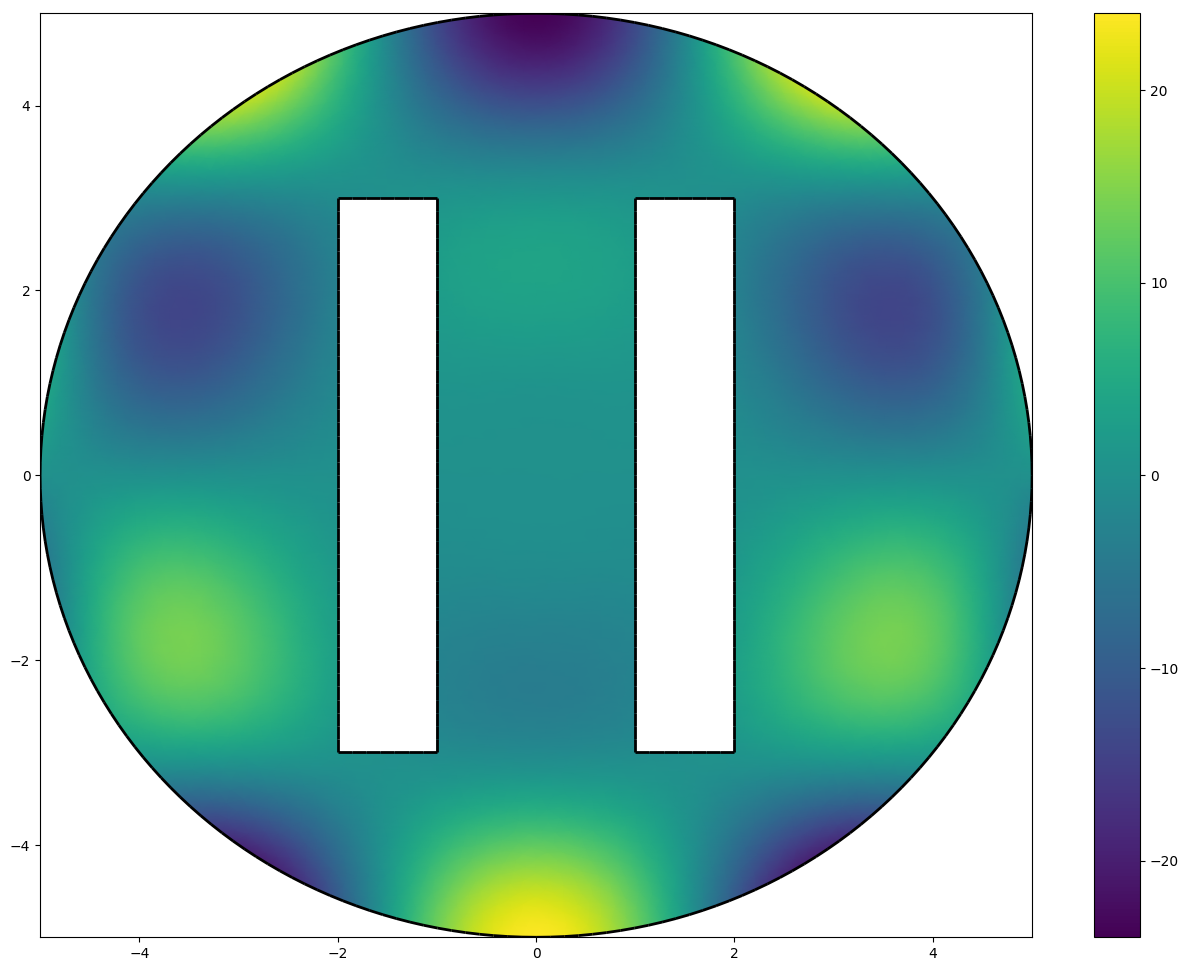
There is a complete source code used to represent a function on a sphere
.. code:: python
  import matplotlib.pyplot as plt
  from fc_tools.Matplotlib import set_axes_equal
  import fc_matplotlib4mesh as plt4sim
  from fc_matplotlib4mesh.demos import getMesh3Ds
  import numpy as np
  q2,me2=getMesh3Ds(2)
  q1,me1=getMesh3Ds(1)
  f=lambda x,y,z: np.cos(3*x-1)*np.sin(2*y-2)*np.sin(3*z)
  u2=f(q2[0],q2[1],q2[2])
  u1=f(q1[0],q1[1],q1[2])
  plt.ion()
  plt.figure(1)
  pp=plt4sim.plot(q2,me2,u2)
  plt4sim.plotmesh(q1,me1,color='Black',linewidths=2)
  plt.colorbar(pp)
  plt.axis('off')
  set_axes_equal()
  plt.figure(2)
  pp=plt4sim.plot(q1,me1,u1,linewidths=2,vmin=min(u2),vmax=max(u2))
  plt4sim.plotmesh(q2,me2,color='LightGray',alpha=0.1)
  plt.colorbar(pp)
  plt.axis('off')
  set_axes_equal()
.. |plot3Ds_fig1| image:: http://www.math.univ-paris13.fr/~cuvelier/software/codes/Python/fc-matplotlib4mesh/snapshots/matplotlib4mesh_plot3Ds_fig1.png
:width: 300
:align: middle
.. |plot3Ds_fig2| image:: http://www.math.univ-paris13.fr/~cuvelier/software/codes/Python/fc-matplotlib4mesh/snapshots/matplotlib4mesh_plot3Ds_fig2.png
:width: 300
:align: middle
+----------------+----------------+
| |plot3Ds_fig1| | |plot3Ds_fig2| |
+----------------+----------------+


