Security News
Crates.io Users Targeted by Phishing Emails
The Rust Security Response WG is warning of phishing emails from rustfoundation.dev targeting crates.io users.
By Sarah Gooding - Sep 12, 2025
.. |PyVersions| image:: https://img.shields.io/pypi/pyversions/gmplot?style=flat-square .. _PyVersions: https://www.python.org/
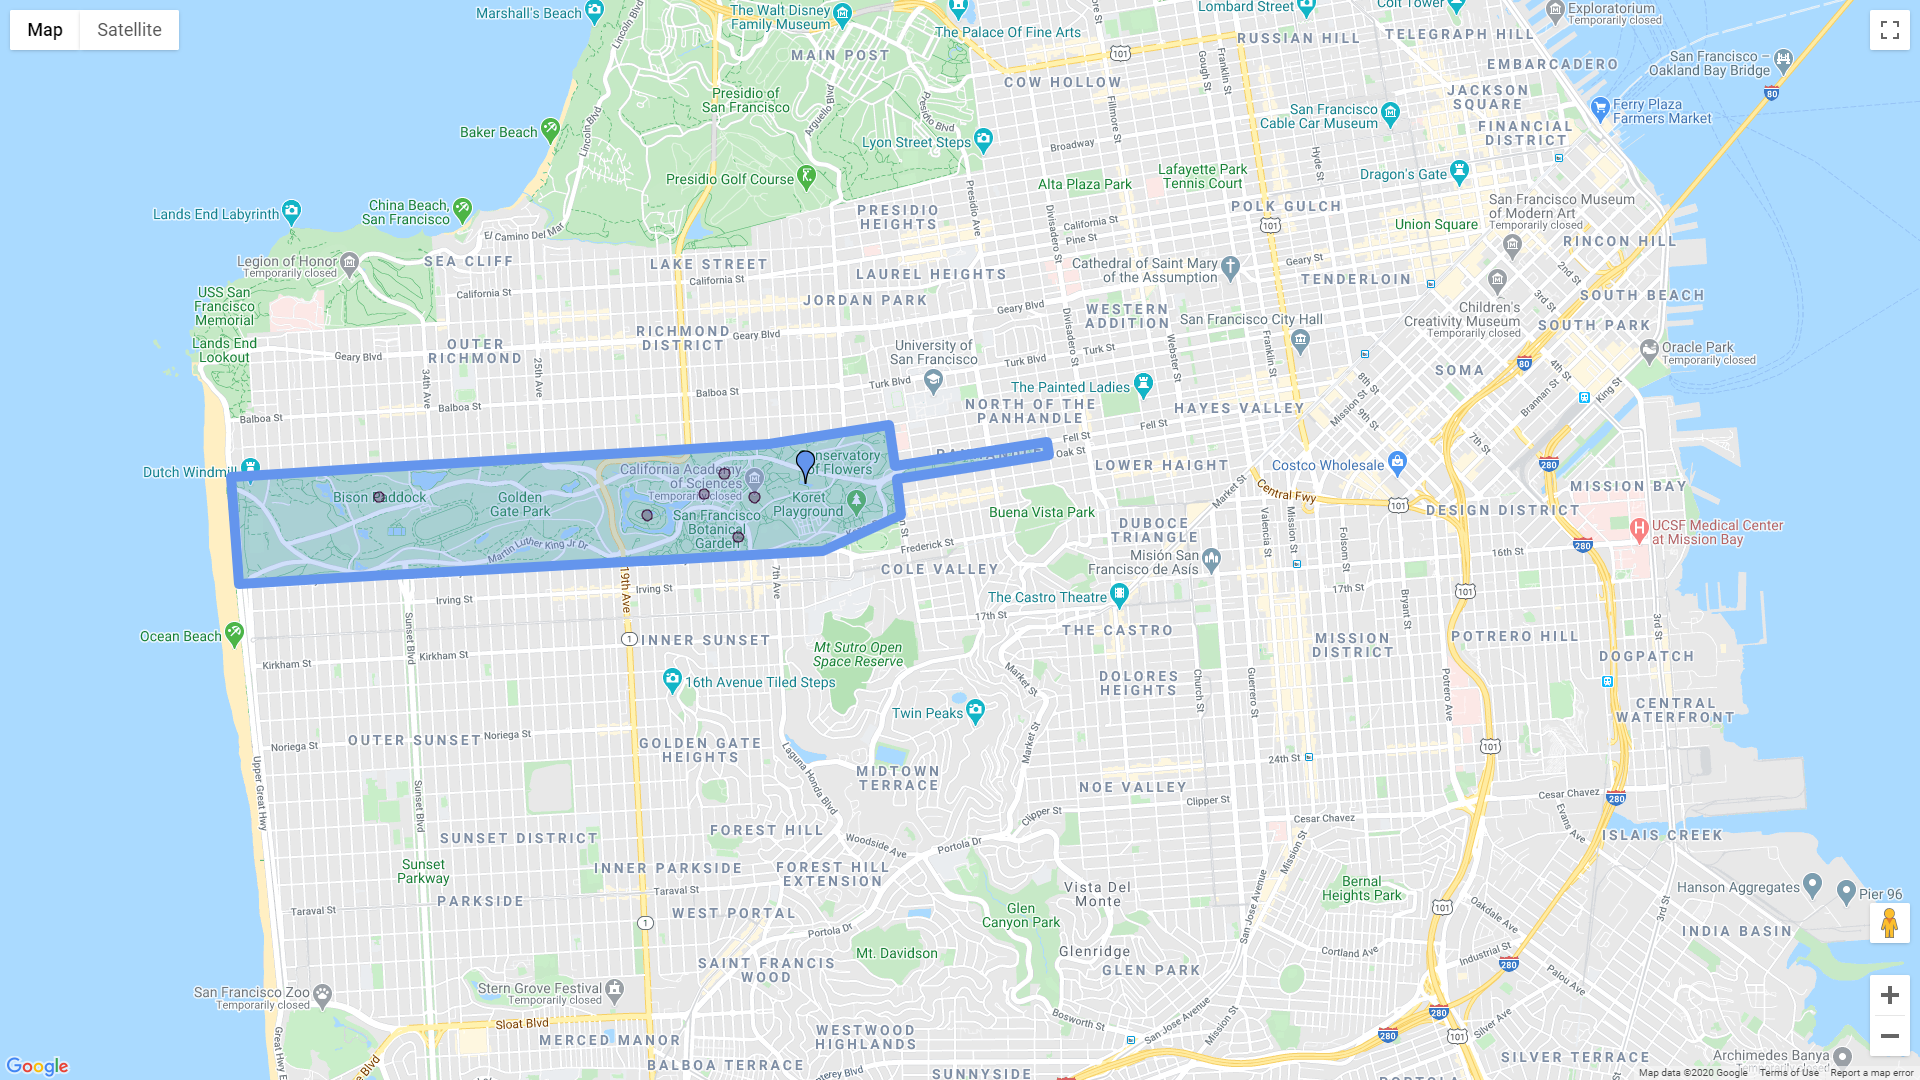
A matplotlib-like interface to render all the data you'd like on top of Google Maps.
Several plotting methods make creating exploratory map views effortless.
To install: pip install gmplot
Documentation (with examples): API Reference <https://github.com/gmplot/gmplot/wiki>_
.. code:: python
import gmplot

# Create the map plotter:
apikey = '' # (your API key here)
gmap = gmplot.GoogleMapPlotter(37.766956, -122.448481, 14, apikey=apikey)

# Outline the Golden Gate Park:
golden_gate_park = zip(*[
    (37.771269, -122.511015),
    (37.773495, -122.464830),
    (37.774797, -122.454538),
    (37.771988, -122.454018),
    (37.773646, -122.440979),
    (37.772742, -122.440797),
    (37.771096, -122.453889),
    (37.768669, -122.453518),
    (37.766227, -122.460213),
    (37.764028, -122.510347)
])
gmap.polygon(*golden_gate_park, color='cornflowerblue', edge_width=10)

# Highlight some attractions:
attractions_lats, attractions_lngs = zip(*[
    (37.769901, -122.498331),
    (37.768645, -122.475328),
    (37.771478, -122.468677),
    (37.769867, -122.466102),
    (37.767187, -122.467496),
    (37.770104, -122.470436)
])
gmap.scatter(attractions_lats, attractions_lngs, color='#3B0B39', size=40, marker=False)

# Mark a hidden gem:
gmap.marker(37.770776, -122.461689, color='cornflowerblue')

# Draw the map:
gmap.draw('map.html')
.. image:: https://raw.githubusercontent.com/gmplot/gmplot/master/docs/images/README_Example.png
Inspired by Yifei Jiang's (jiangyifei@gmail.com) pygmaps <http://code.google.com/p/pygmaps/>_ module.
FAQs
A matplotlib-like interface to plot data with Google Maps.
We found that gmplot demonstrated a healthy version release cadence and project activity because the last version was released less than a year ago. It has 2 open source maintainers collaborating on the project.
Did you know?

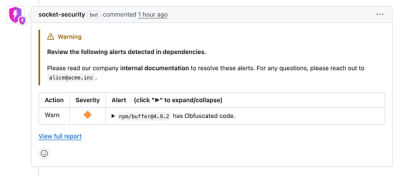
Socket for GitHub automatically highlights issues in each pull request and monitors the health of all your open source dependencies. Discover the contents of your packages and block harmful activity before you install or update your dependencies.
Security News
The Rust Security Response WG is warning of phishing emails from rustfoundation.dev targeting crates.io users.
Product
Socket now lets you customize pull request alert headers, helping security teams share clear guidance right in PRs to speed reviews and reduce back-and-forth.

Product
Socket's Rust support is moving to Beta: all users can scan Cargo projects and generate SBOMs, including Cargo.toml-only crates, with Rust-aware supply chain checks.