Google Calendar Analytics

This Python program allows you to perform analytics on your Google Calendar events. With this program, you can visualize
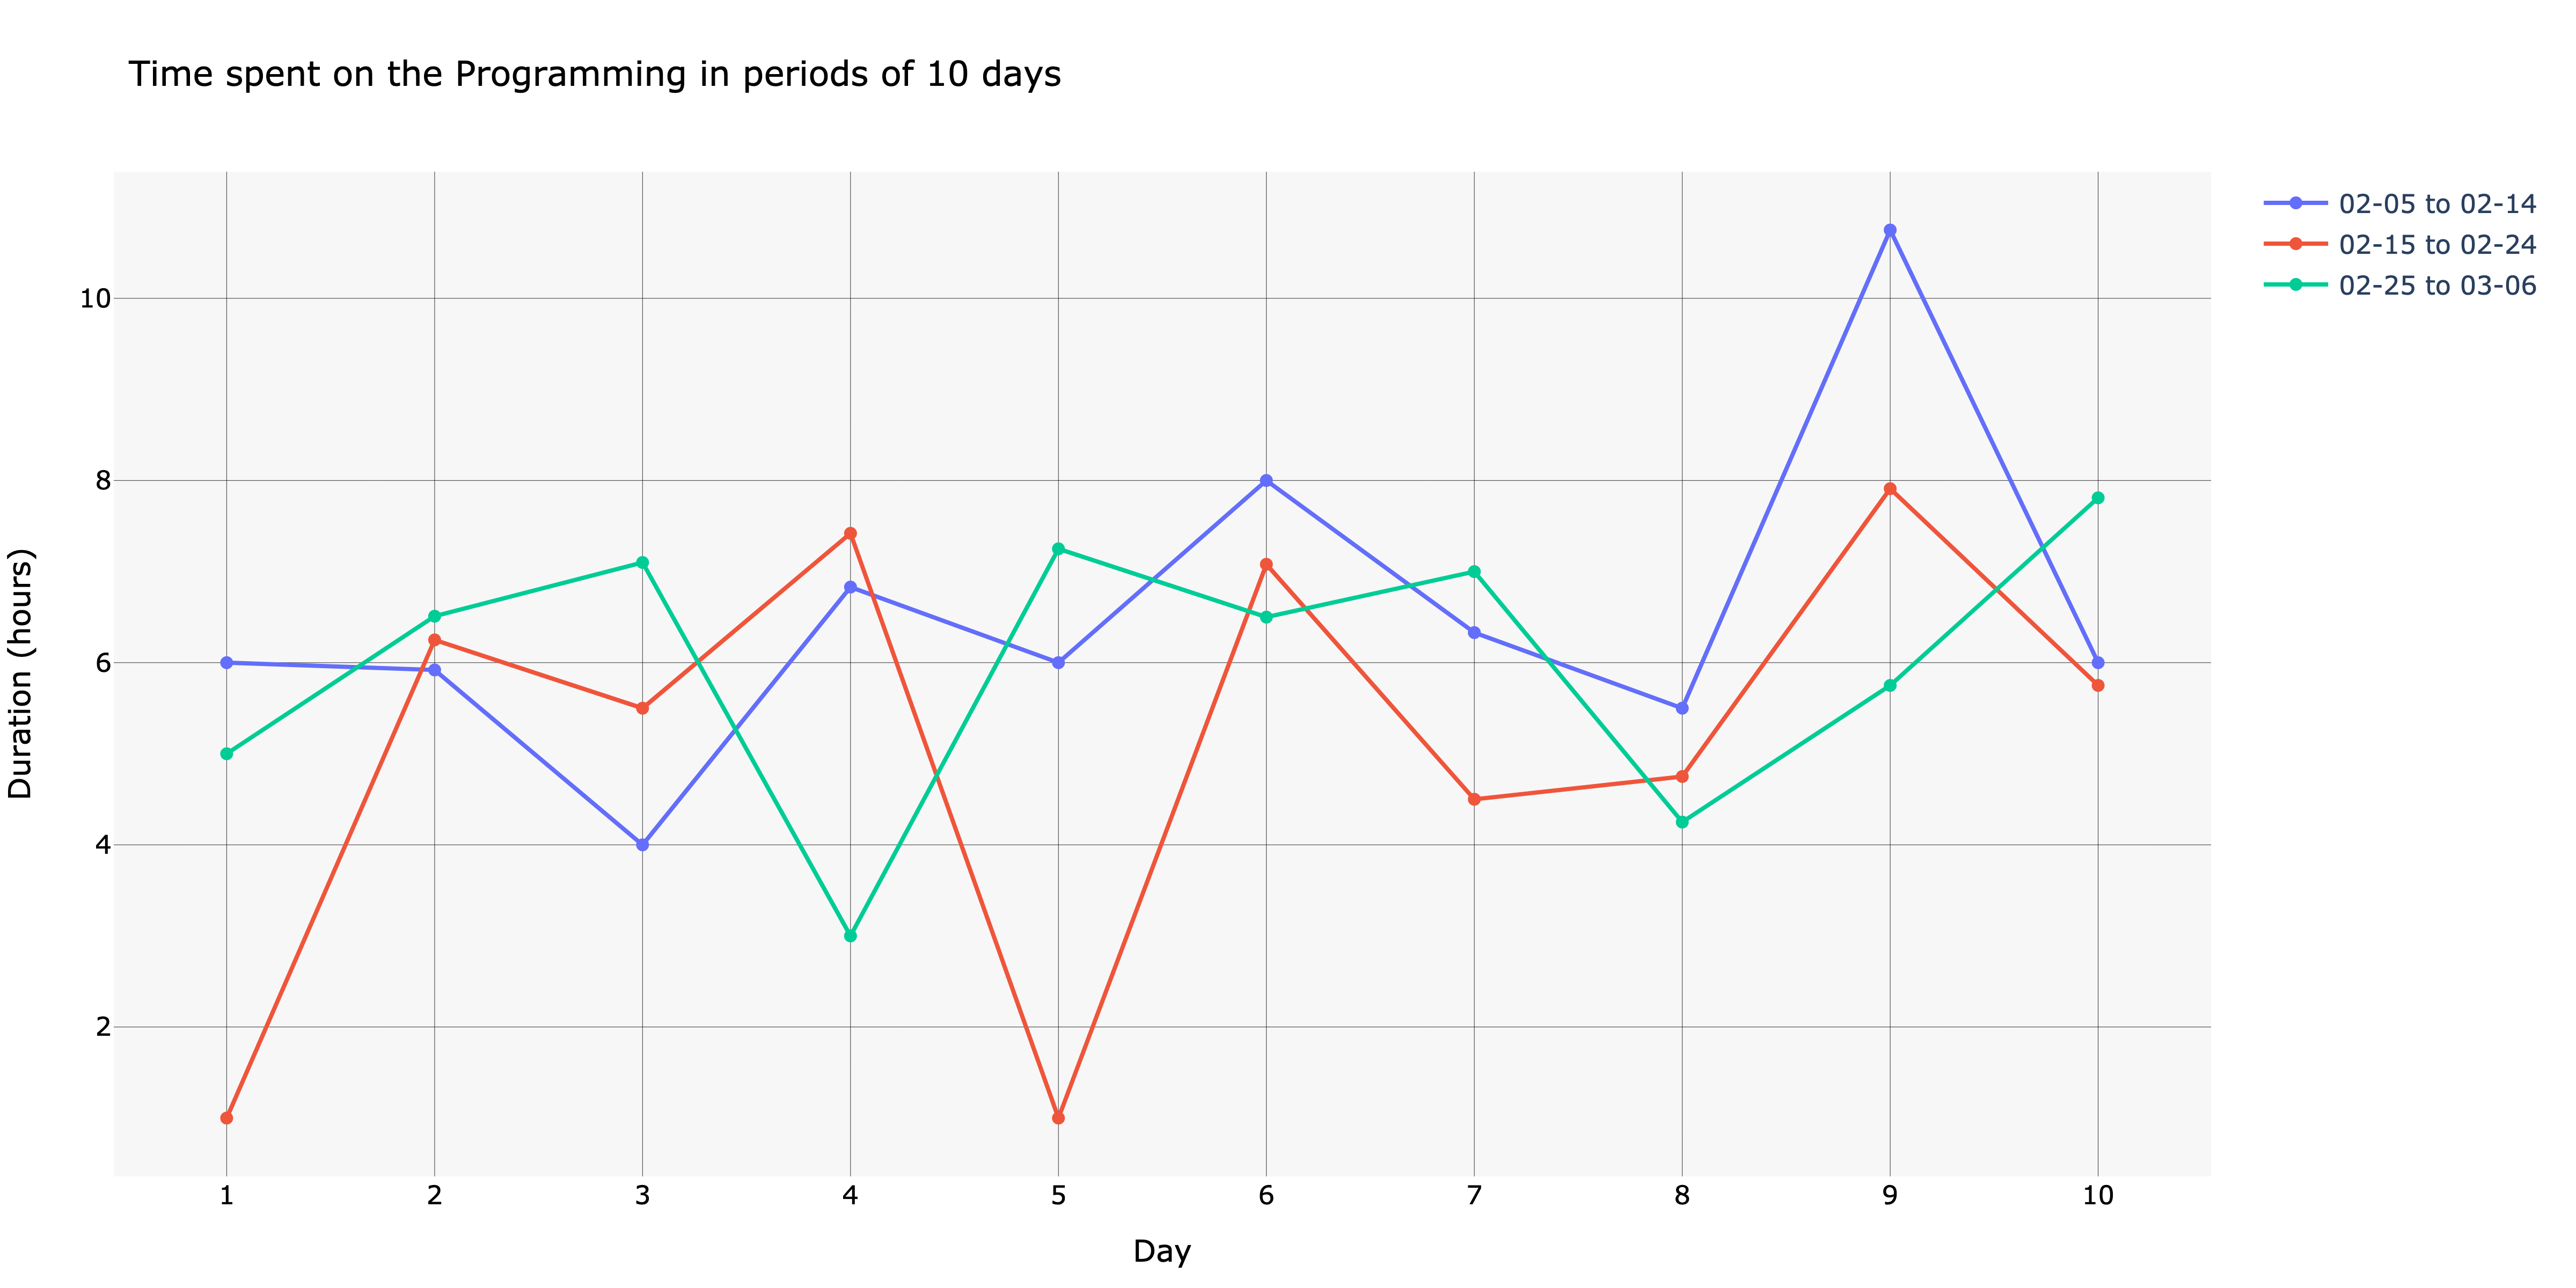
the total duration of your events, compare the length of events across different time periods, and gain insights into
which events take up the most time.
Features
- Async support for faster data retrieval and chart generation
- Extract events from your Google Calendar
- Compute the total duration of events in a specified time range
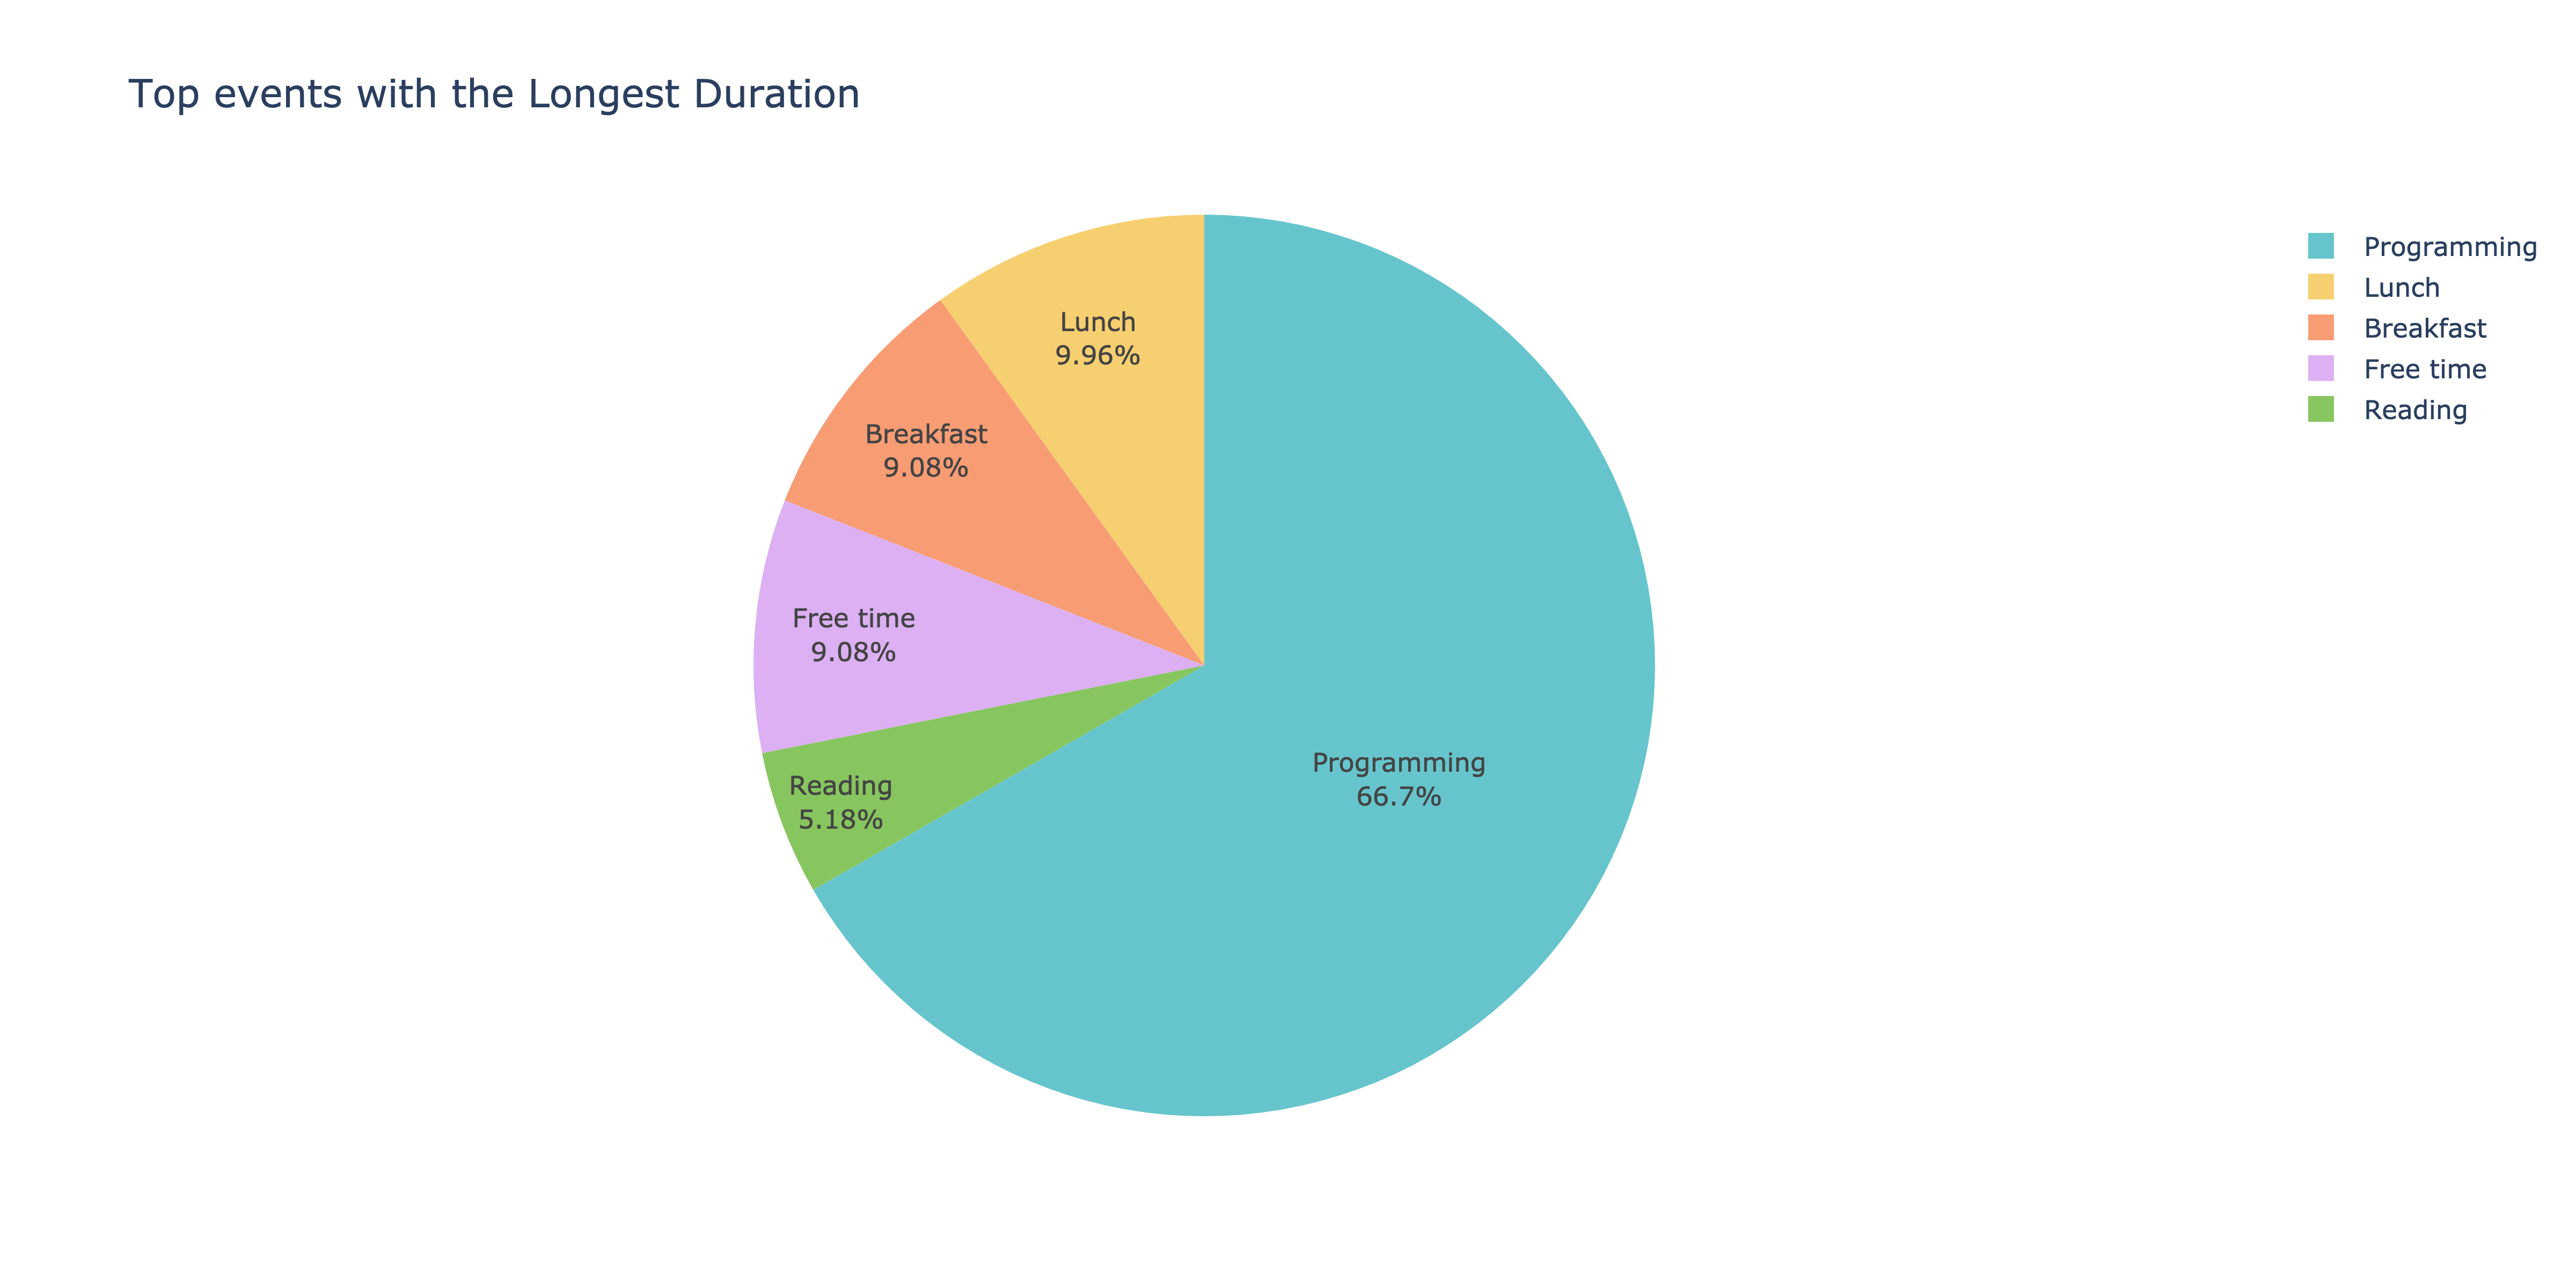
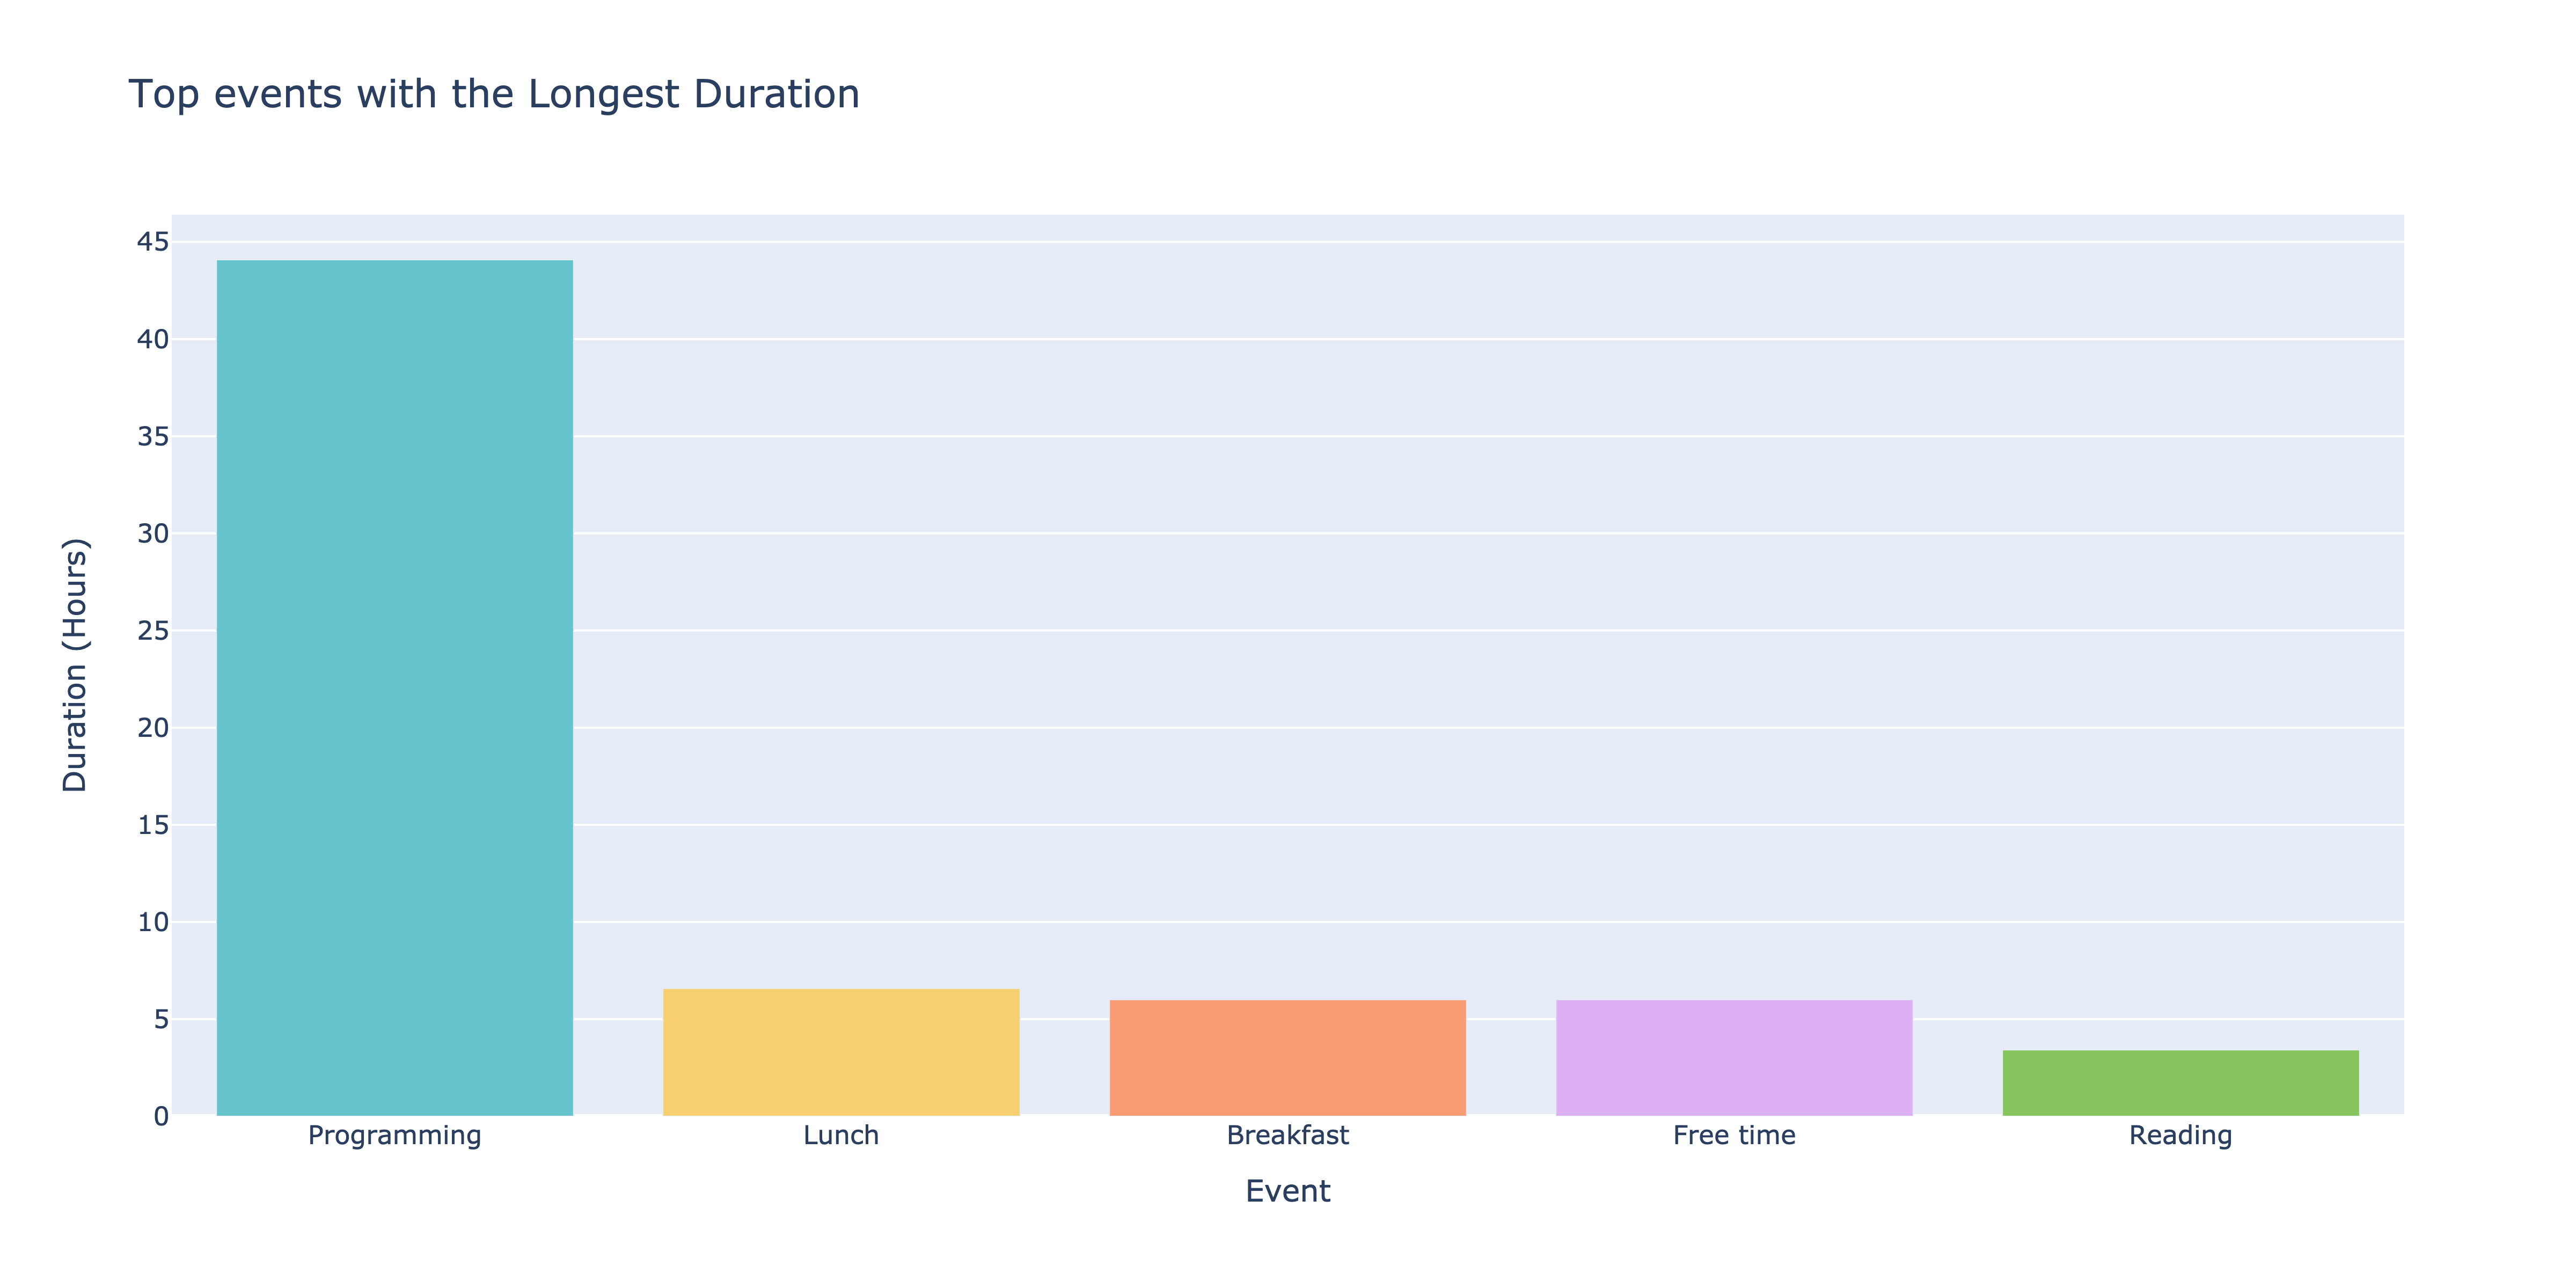
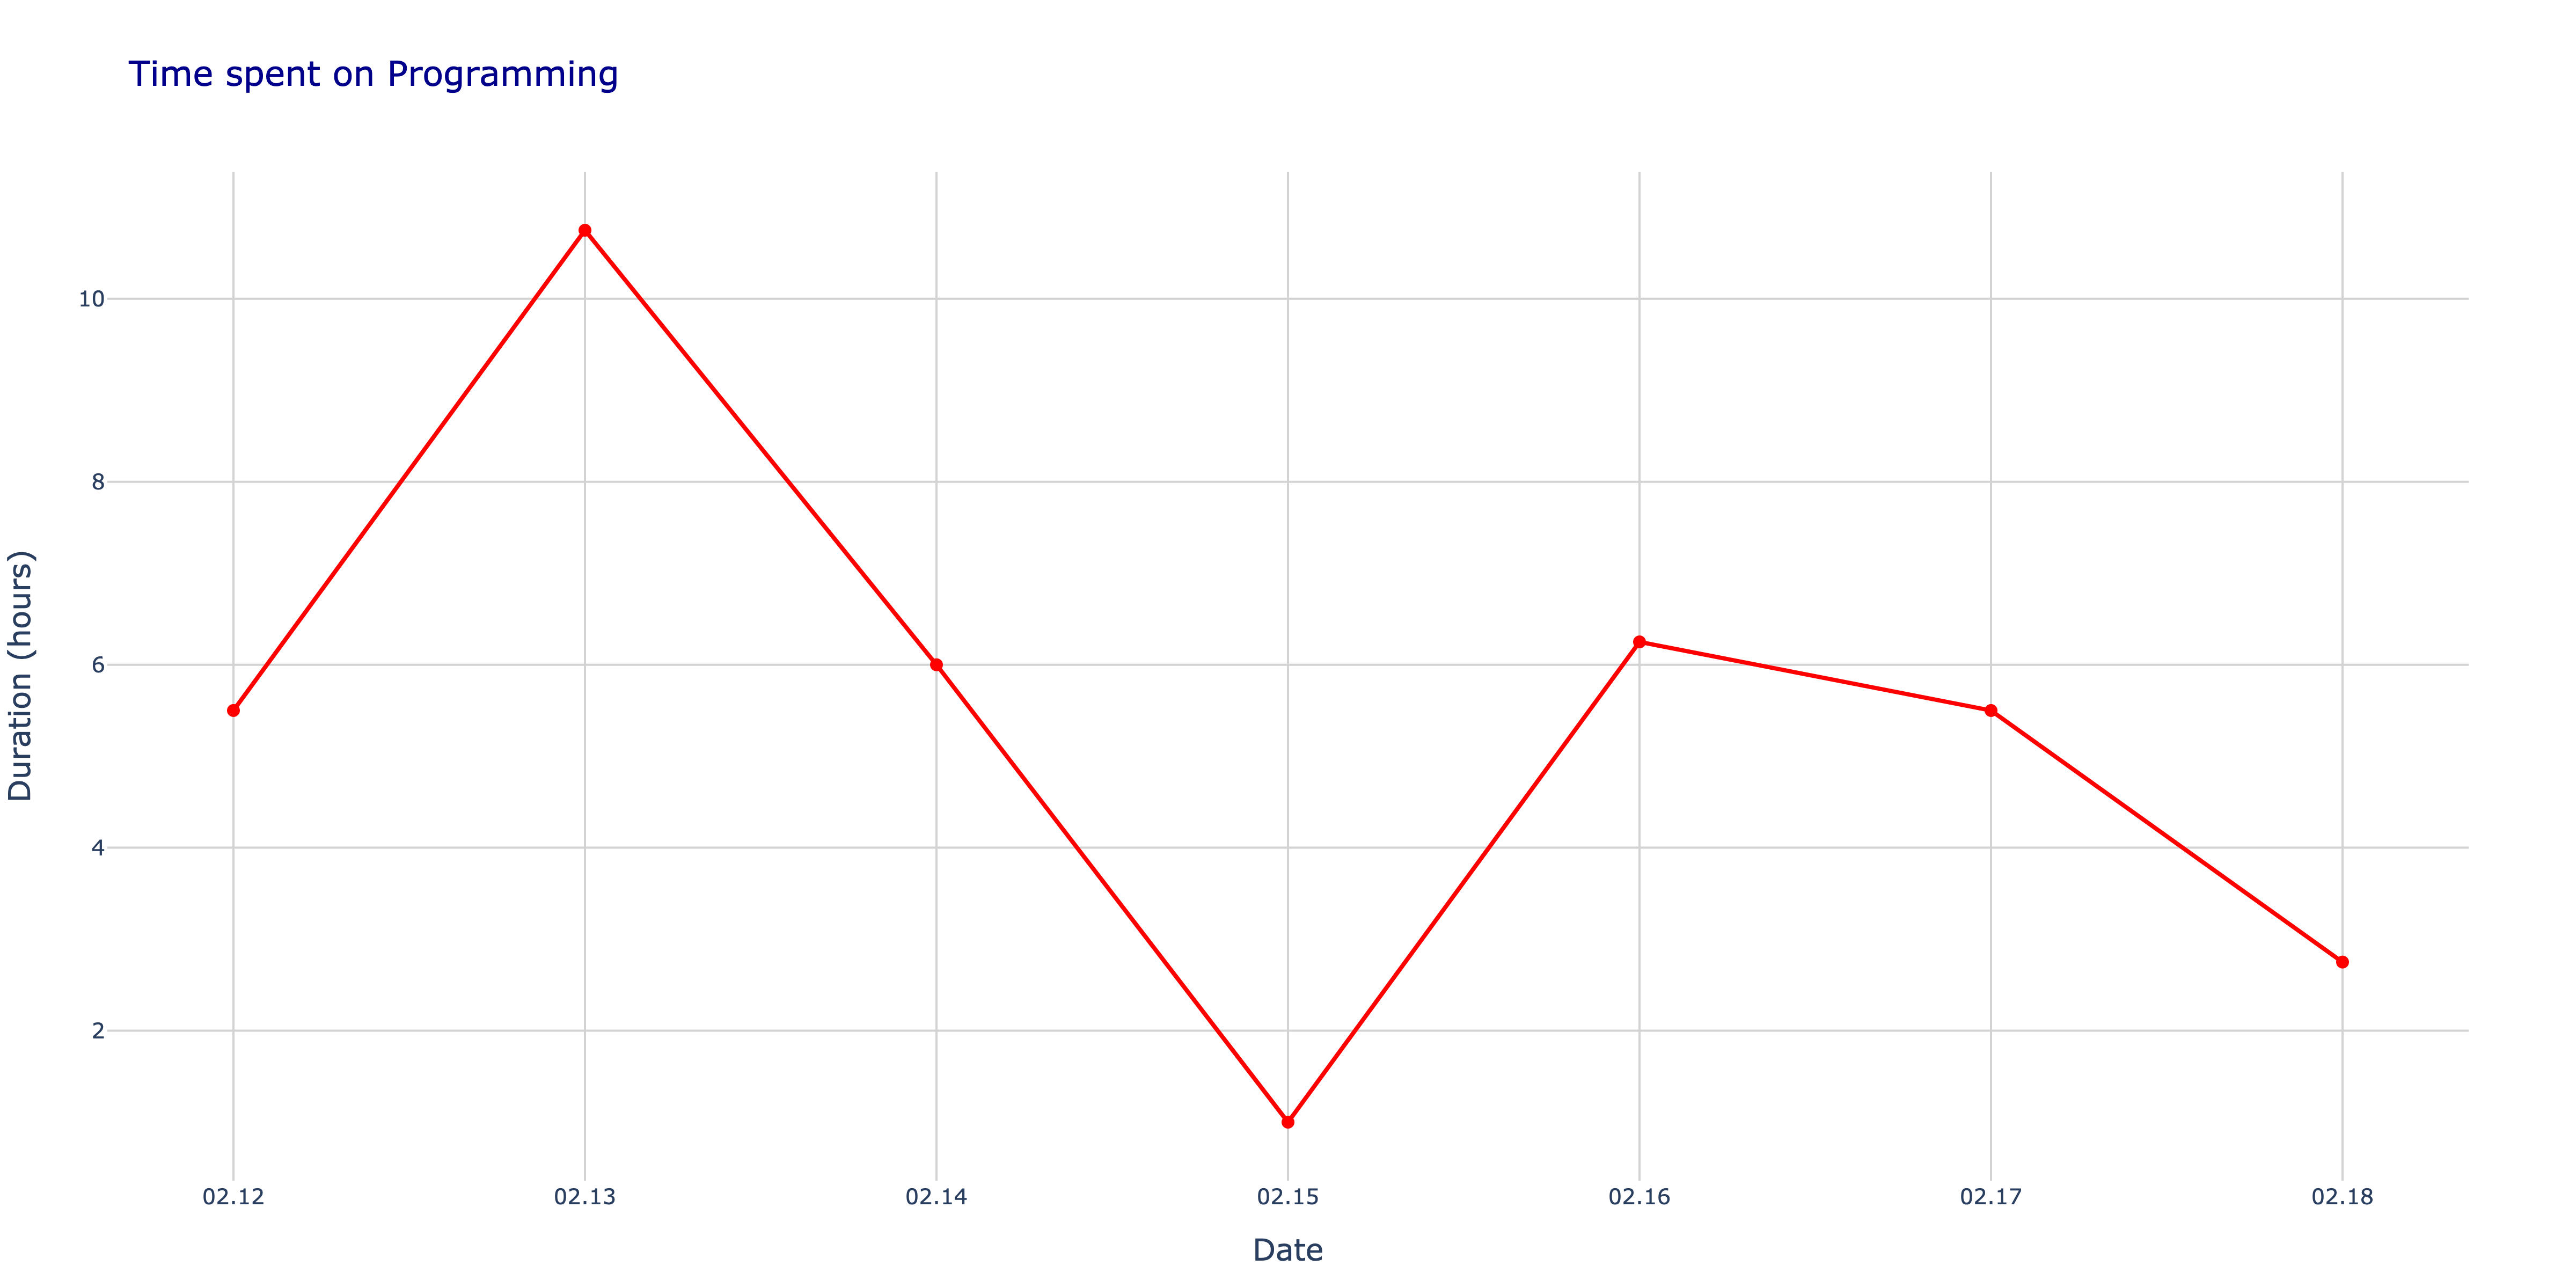
- Visualize the duration of events in a pie chart, bar chart, line chart and more
- Limit the number of events displayed in the charts
- Wide chart customization. For example, dark mode and transparent background
Quick Start
To use the Google Calendar Analytics program, first install the dependencies by running the following command:
pip install google-calendar-analytics
You can then import the AnalyzerFacade class and use it to analyze your data:
How to get credentials from Google?
import asyncio
from datetime import datetime
from google.oauth2.credentials import Credentials
from google_calendar_analytics import AnalyzerFacade
creds = {
"token": "ya29.a0AVvZVsoH4qZcrGK25VwsXspJv-r9K-",
"refresh_token": "1//0hwlhrtalKgeRCgYIARAAGBESNwF-",
"token_uri": "https://oauth2.googleapis.com/token",
"client_id": "395np.apps.googleusercontent.com",
"client_secret": "GOCSPXFqoucE03VRVz",
"scopes": ["https://www.googleapis.com/auth/calendar"],
"expiry": "2023-02-18T15:30:15.674219Z"
}
creds = Credentials.from_authorized_user_info(creds)
Once you have created the credentials, you can create an instance of the AnalyzerFacade class and use it to analyze your data:
start_time = datetime(2023, 3, 1)
end_time = datetime(2023, 3, 18)
async def main():
async with AnalyzerFacade(creds=creds) as analyzer:
plot = await analyzer.analyze_one(start_time, end_time, event_name="Programming", plot_type="Line")
plot.show()
if __name__ == "__main__":
asyncio.run(main())
What's about multiple plots?
async def main():
    async with AnalyzerFacade(creds=creds) as analyzer:
        coroutines = []

        coroutines.append(analyzer.analyze_one(start_time, end_time, event_name="Programming", plot_type="Line")
        coroutines.append(analyzer.analyze_one(start_time, end_time, event_name="Reading", plot_type="Line"))
        coroutines.append(analyzer.analyze_many(start_time, end_time, plot_type="Pie"))
        coroutines.append(analyzer.analyze_many(start_time, end_time, plot_type="Bar"))

        result = await asyncio.gather(*coroutines)
        for plot in result:
            plot.show()
Contribution
If you would like to contribute to this project, please feel free to submit a pull request. Some areas where
contributions are particularly welcome include:
- Adding new features
- Improving existing features
- Debugging and fixing bugs
- Adding tests to ensure the program is working as expected
Analytics example: