
Security News
The Nightmare Before Deployment
Season’s greetings from Socket, and here’s to a calm end of year: clean dependencies, boring pipelines, no surprises.
By Ahmad Nassri - Dec 16, 2025
heatmapcluster
Advanced tools
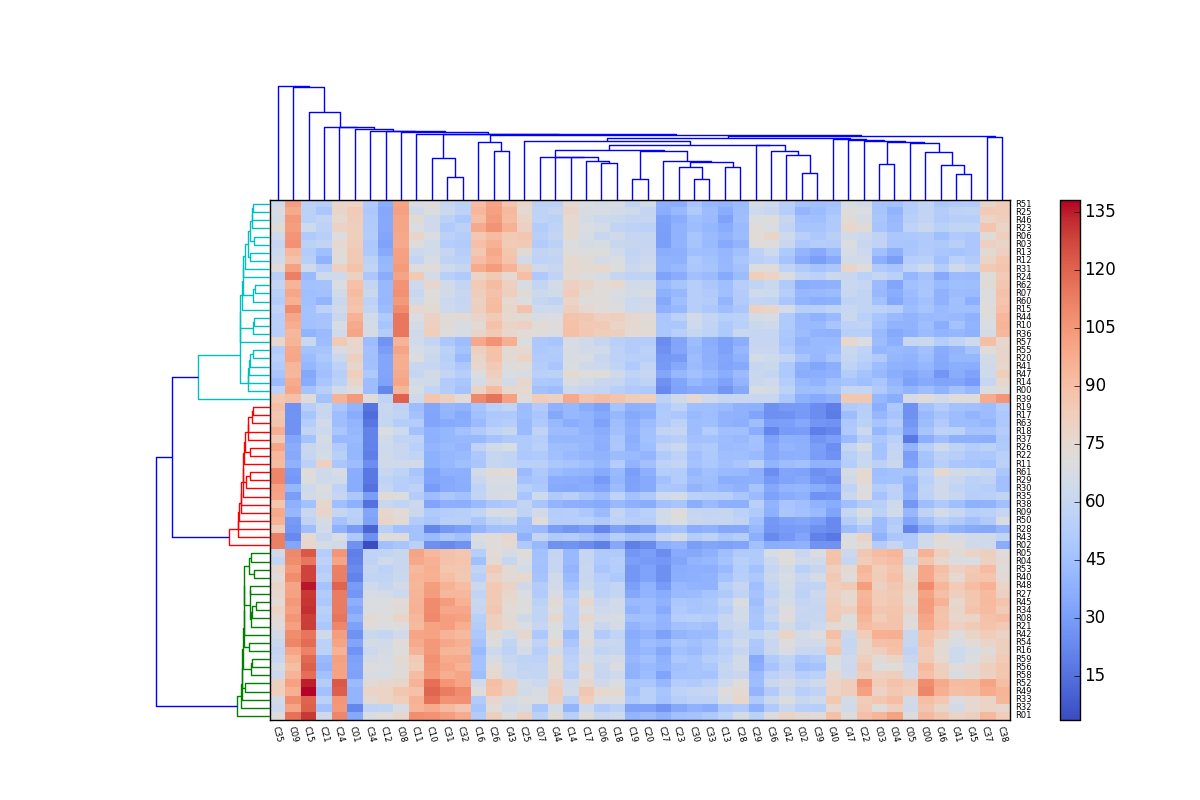
heatmapcluster is a python library for generating a clustered heatmap
with dendrograms plotted along with the heatmap, such as the following:
.. image:: https://raw.githubusercontent.com/WarrenWeckesser/heatmapcluster/master/demo/heatmapcluster_demo.png :alt: Example plot :align: center :scale: 50 %
This is prototype-quality software. The documentation is sparse, and the API will likely change.
Plots are generated with matplotlib (http://matplotlib.org/). To use the package, numpy, scipy and matplotlib must be installed.
setuptools is required to install the package using setup.py.
This is heatmapcluster_demo.py. Most of the code is the function make_data,
which generates an array of data for the demonstration. The main part of the
demo is the last three statements of the script. This script generates the plot
shown above::
import numpy as np
import matplotlib.pyplot as plt
from heatmapcluster import heatmapcluster


def make_data(size, seed=None):
    if seed is not None:
        np.random.seed(seed)

    s = np.random.gamma([7, 6, 5], [6, 8, 6], size=(size[1], 3)).T
    i = np.random.choice(range(len(s)), size=size[0])
    x = s[i]

    t = np.random.gamma([8, 5, 6], [3, 3, 2.1], size=(size[0], 3)).T
    j = np.random.choice(range(len(t)), size=size[1])

    x += 1.1*t[j].T

    x += 2*np.random.randn(*size)

    row_labels = [('R%02d' % k) for k in range(x.shape[0])]
    col_labels = [('C%02d' % k) for k in range(x.shape[1])]

    return x, row_labels, col_labels


x, row_labels, col_labels = make_data(size=(64, 48), seed=123)

h = heatmapcluster(x, row_labels, col_labels,
                   num_row_clusters=3, num_col_clusters=0,
                   label_fontsize=6,
                   xlabel_rotation=-75,
                   cmap=plt.cm.coolwarm,
                   show_colorbar=True,
                   top_dendrogram=True)
plt.show()
FAQs
Heatmap cluster dendrogram plotter.
We found that heatmapcluster demonstrated a healthy version release cadence and project activity because the last version was released less than a year ago. It has 1 open source maintainer collaborating on the project.
Did you know?

Socket for GitHub automatically highlights issues in each pull request and monitors the health of all your open source dependencies. Discover the contents of your packages and block harmful activity before you install or update your dependencies.
Security News
Season’s greetings from Socket, and here’s to a calm end of year: clean dependencies, boring pipelines, no surprises.

Research
/Security News
Impostor NuGet package Tracer.Fody.NLog typosquats Tracer.Fody and its author, using homoglyph tricks, and exfiltrates Stratis wallet JSON/passwords to a Russian IP address.

Security News
Deno 2.6 introduces deno audit with a new --socket flag that plugs directly into Socket to bring supply chain security checks into the Deno CLI.