
hepstats package: statistics tools and utilities


hepstats is a library for statistical inference aiming to cover the needs High Energy Physics.
It is part of the Scikit-HEP project.
Questions: for usage questions, use StackOverflow with the hepstats tag
Bugs and odd behavior: open an issue with hepstats
Installation
Install hepstats like any other Python package:
pip install hepstats
or similar (use e.g. virtualenv if you wish).
Changelog
See the changelog for a history of notable changes.
Getting Started
The hepstats module includes modeling, hypotests and splot submodules. This a quick user guide to each submodule. The binder examples are also a good way to get started.
modeling
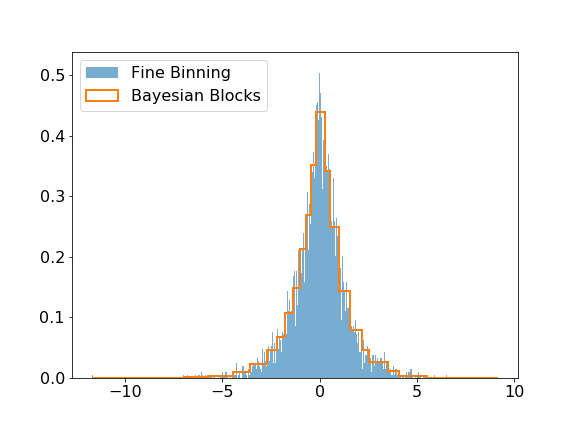
The modeling submodule includes the Bayesian Block algorithm that can be used to improve the binning of histograms. The visual improvement can be dramatic, and more importantly, this algorithm produces histograms that accurately represent the underlying distribution while being robust to statistical fluctuations. Here is a small example of the algorithm applied on Laplacian sampled data, compared to a histogram of this sample with a fine binning.
>>> import numpy as np
>>> import matplotlib.pyplot as plt
>>> from hepstats.modeling import bayesian_blocks

>>> data = np.random.laplace(size=10000)
>>> blocks = bayesian_blocks(data)

>>> plt.hist(data, bins=1000, label='Fine Binning', density=True, alpha=0.6)
>>> plt.hist(data, bins=blocks, label='Bayesian Blocks', histtype='step', density=True, linewidth=2)
>>> plt.legend(loc=2)
hypotests
This submodule provides tools to do hypothesis tests such as discovery test and computations of upper limits or confidence intervals. hepstats needs a fitting backend to perform computations such as zfit. Any fitting library can be used if their API is compatible with hepstats (see api checks).
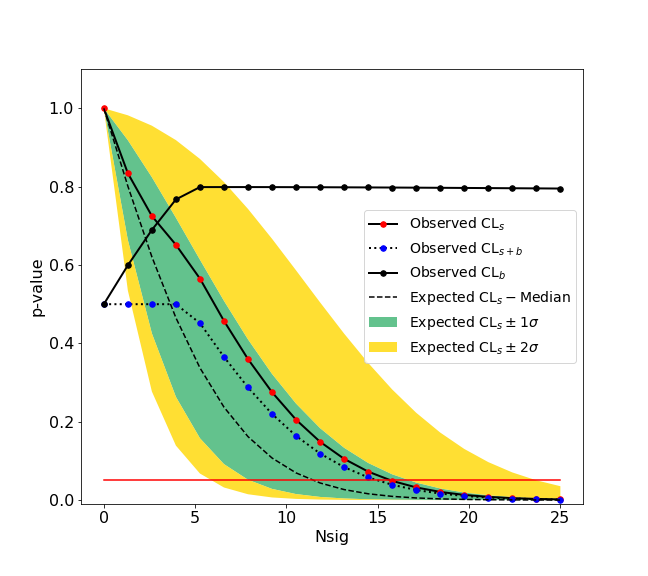
We give here a simple example of an upper limit calculation of the yield of a Gaussian signal with known mean and sigma over an exponential background. The fitting backend used is the zfit package. An example with a counting experiment analysis is also given in the binder examples.
>>> import zfit
>>> from zfit.loss import ExtendedUnbinnedNLL
>>> from zfit.minimize import Minuit

>>> bounds = (0.1, 3.0)
>>> obs = zfit.Space('x', limits=bounds)

>>> bkg = np.random.exponential(0.5, 300)
>>> peak = np.random.normal(1.2, 0.1, 10)
>>> data = np.concatenate((bkg, peak))
>>> data = data[(data > bounds[0]) & (data < bounds[1])]
>>> N = data.size
>>> data = zfit.Data.from_numpy(obs=obs, array=data)

>>> lambda_ = zfit.Parameter("lambda", -2.0, -4.0, -1.0)
>>> Nsig = zfit.Parameter("Nsig", 1., -20., N)
>>> Nbkg = zfit.Parameter("Nbkg", N, 0., N*1.1)
>>> signal = zfit.pdf.Gauss(obs=obs, mu=1.2, sigma=0.1).create_extended(Nsig)
>>> background = zfit.pdf.Exponential(obs=obs, lambda_=lambda_).create_extended(Nbkg)
>>> total = zfit.pdf.SumPDF([signal, background])
>>> loss = ExtendedUnbinnedNLL(model=total, data=data)

>>> from hepstats.hypotests.calculators import AsymptoticCalculator
>>> from hepstats.hypotests import UpperLimit
>>> from hepstats.hypotests.parameters import POI, POIarray

>>> calculator = AsymptoticCalculator(loss, Minuit(), asimov_bins=100)
>>> poinull = POIarray(Nsig, np.linspace(0.0, 25, 20))
>>> poialt = POI(Nsig, 0)
>>> ul = UpperLimit(calculator, poinull, poialt)
>>> ul.upperlimit(alpha=0.05, CLs=True)

Observed upper limit: Nsig = 15.725784747406346
Expected upper limit: Nsig = 11.927442041887158
Expected upper limit +1 sigma: Nsig = 16.596396280677116
Expected upper limit -1 sigma: Nsig = 8.592750403611896
Expected upper limit +2 sigma: Nsig = 22.24864429383046
Expected upper limit -2 sigma: Nsig = 6.400549971360598
splots
A full example using the sPlot algorithm can be found here. sWeights for different components in a data sample, modeled with a sum of extended probability density functions, are derived using the compute_sweights function:
>>> from hepstats.splot import compute_sweights
>>> sweights = compute_sweights(zfit.pdf.SumPDF([signal, background]), data)
>>> bkg_sweights = sweights[Nbkg]
>>> sig_sweights = sweights[Nsig]
The model needs to be fitted to the data for the computation of the sWeights, if not an error is raised.