
Security News
Django Joins curl in Pushing Back on AI Slop Security Reports
Django has updated its security policies to reject AI-generated vulnerability reports that include fabricated or unverifiable content.
By Sarah Gooding - Jun 30, 2025
Mapsy is a Python library designed easily render static maps in python. It is designed to be simple to use and easy to integrate with existing codebases. The library supports rendering background, tiled raster, filled polygon, and other layers on the map. It directly supports geometric primitives, allowing users to directly render shapely geometries.
Input data must be in the EPSG:4326 - WGS84 projection.
| type | status | description | data source |
|---|---|---|---|
BackgroundLayer | ✅ | renders a simple background with a single color | Color |
TiledRasterLayer | ✅ | renders a tiled raster layer can can load xyz tiles | xyz via http(s) |
FillLayer | ✅ | renders a fill layer for polygons | Polygon and MultiPolygon |
LineLayer | ✅ | renders a line layer that draw LineStrings | LineString and MultiLineString |
CircleLayer | ✅ | renders a circle layer for Points | Point and MultiPoint |
SymbolLayer | ✅ | renders a symbol and/or text for points | Point and MultiPoint |
Attribution | ✅ | an attribution | str and list[str] |
You can simply install the library using pip:
pip install mapsy
IMPORTANT: This library uses Cairo. You will have to install cairo with your package manager of choice.
on mac
brew install cairo
The Mapsy library is designed to be simple to use. The following sections provide examples of how to create a map with different layers. Note that in almost all cases you would have to add an attribution layer to the map. For example, if you use OpenStreetMap tiles, you would have to add the OpenStreetMap attribution to the map. This is not done automatically!
Here is an example of how to create a simple map with a tiled raster layer:
import mapsy

my_map = mapsy.Map()
tile_layer = mapsy.TiledRasterLayer(
    [
        "https://tile.openstreetmap.org/{z}/{x}/{y}.png",
    ]
)
my_map.add_layer(tile_layer)
my_map.add_layer(mapsy.Attribution("© OpenStreetMap contributors"))

surf = my_map.render(
    mapsy.FixedScreenSize(
        mapsy.Box.from_lng_lat(5.988, 47.302, 15.016, 54.983), mapsy.ScreenSize(512, 512)
    )
)
surf.write_to_png("my_map.png")
A background layer provides a solid color background for the map.
background_layer = mapsy.BackgroundLayer(mapsy.Color(1, 1, 1))
my_map.add_layer(background_layer)
A tiled raster layer allows the use of map tiles from sources like OpenStreetMap.
tile_layer = mapsy.TiledRasterLayer(
    [
        "https://tile.openstreetmap.org/{z}/{x}/{y}.png",
    ]
)
my_map.add_layer(tile_layer)
A fill layer can be used to add filled polygons with customizable colors and borders.
from shapely.geometry import shape

polygon = shape(json)
fill_layer = mapsy.FillLayer(
    [
        mapsy.FillItem(
            geometry=polygon,
            fill_color=mapsy.Color(0.5, 0.5, 0.5, 0.3),
            line_color=mapsy.Color(0, 0, 0),
            line_width=2,
        )
    ]
)
my_map.add_layer(fill_layer)
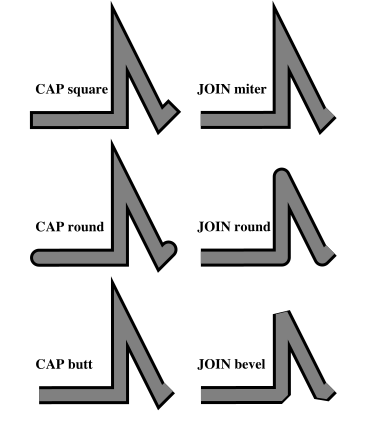
A line layer can be used to show LineStrings on the map
from shapely.geometry import shape

line = shape(json)
fill_layer = mapsy.LineLayer(
    [
        mapsy.LineItem(
            geometry=line,
            join=mapsy.LineJoin.round,
            cap=mapsy.LineCap.round
            width=12,
            outline_width=3,
            outline_color=Colors.BLACK,
        )
    ]
)
my_map.add_layer(fill_layer)
The LineItem options cap and join lead to the following results:
A circle layer can be used to show Points on the map
from shapely.geometry import shape

point = shape(json)
circle_layer = mapsy.CircleLayer(
    [
        mapsy.CircleItem(
            geometry=point,
            fill_color=mapsy.Color(0.5, 0.5, 0.5, 0.3),
            line_color=mapsy.Color(0, 0, 0),
            line_width=2,
            radius=10,
        )
    ]
)
my_map.add_layer(circle_layer)
A symbol layer can be used to show Points on the map. You can load custom icons by using the mapsy.Icon.from_path class method.
from shapely.geometry import shape

point = shape(json)
symbol_layer = mapsy.SymbolLayer(
    [
        mapsy.SymbolItem(
            geometry=point,
            icon=mapsy.Icons.PIN_24,
            text="Hello World",
            text_offset=(0, 16)
        )
    ]
)
my_map.add_layer(symbol_layer)
You can set the anchor of the text with the text_anchor parameter. The default is mapsy.TextAnchor.BOTTOM_LEFT. The following options are available:
 |  |  |
 |  |  |
 |  |  |
An attribution layer can be used to add attribution to the map. This is important if you use tiles from a public source like OpenStreetMap.
attribution = mapsy.Attribution("© OpenStreetMap contributors")
my_map.add_layer(attribution)
The project includes unit tests to ensure the functionality of various components. To run the tests, use the following command:
pytest
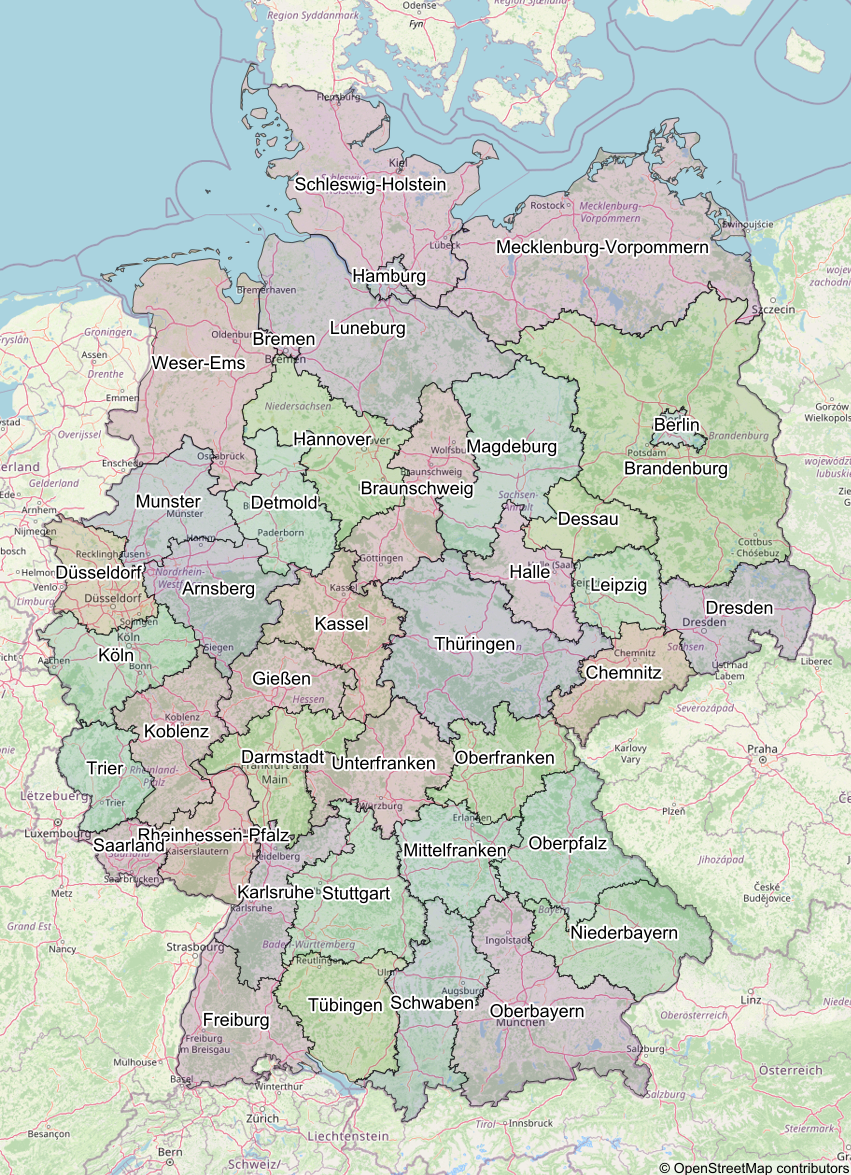
The image below is an example of a map created using the Mapsy library:
This project is licensed under the MIT License.
Contributions are welcome! Please submit a pull request or open an issue for any changes or suggestions.
FAQs
Mapsy is a Python library designed easily render static maps in python.
We found that mapsy demonstrated a healthy version release cadence and project activity because the last version was released less than a year ago. It has 1 open source maintainer collaborating on the project.
Did you know?

Socket for GitHub automatically highlights issues in each pull request and monitors the health of all your open source dependencies. Discover the contents of your packages and block harmful activity before you install or update your dependencies.
Security News
Django has updated its security policies to reject AI-generated vulnerability reports that include fabricated or unverifiable content.

Security News
ECMAScript 2025 introduces Iterator Helpers, Set methods, JSON modules, and more in its latest spec update approved by Ecma in June 2025.

Security News
A new Node.js homepage button linking to paid support for EOL versions has sparked a heated discussion among contributors and the wider community.