

Research
PyPI Package Disguised as Instagram Growth Tool Harvests User Credentials
A deceptive PyPI package posing as an Instagram growth tool collects user credentials and sends them to third-party bot services.
By Kush Pandya - Jun 06, 2025
| Version | Upload Status | Downloads |
|---|---|---|
 |  |
| Version | Upload Status | Size |
|---|---|---|
 |  |
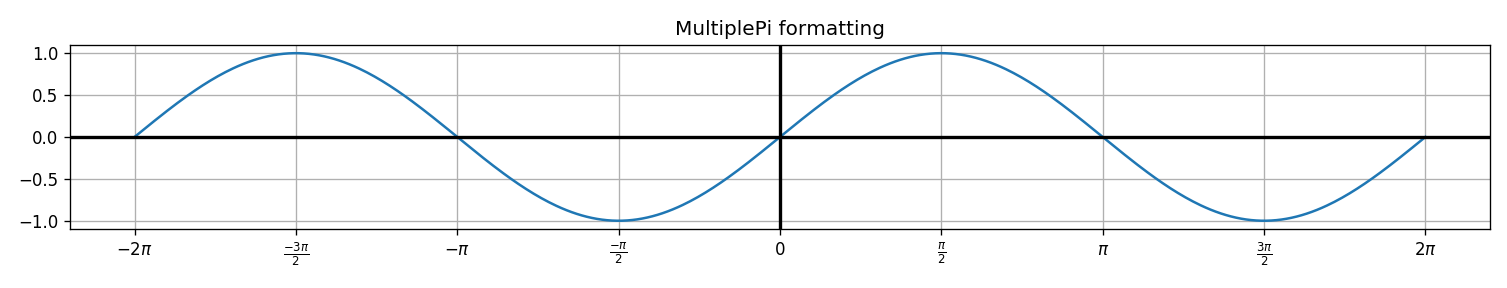
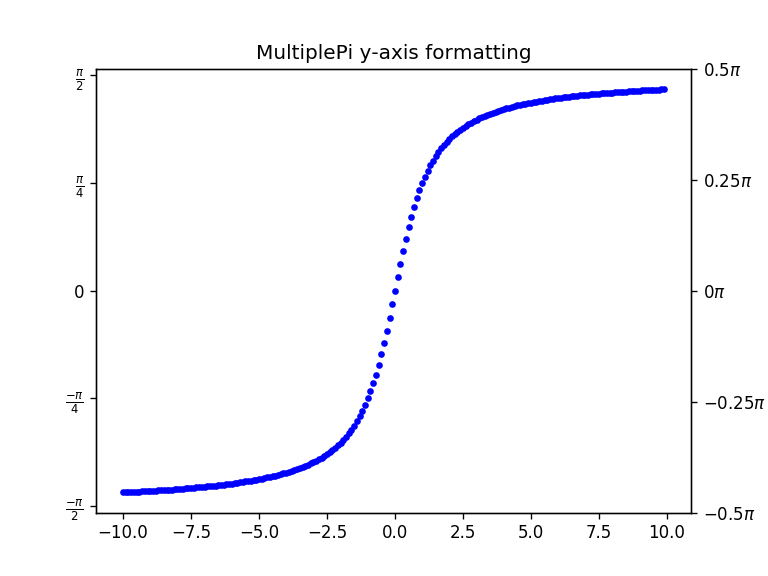
Format multiples of pi as strings on Matplotlib axes.
The MultiplePi class creates a Locator to place ticks at desired multiples and a Formatter to format all tick labels.
The base (π or τ) can be divided by any Natural Number.
Multiples of one-π or one-τ can be placed/formatted too. (2π, 3π, 2τ, 3τ, etc.)
pip install matplot-fmt-pi
from matplot_fmt_pi.ticker import MultiplePi
Simply, the instance can be asssigned a denominator of pi then passed to matplotlib.
The parameters can also be modified to adjust the output to something more sophisticated.

Clone, then from the repo,
cd examples/
python *.py
Put the repo's directory in the python path to import the matplot_fmt_pi folder not the installed package.
PYTHONPATH=/home/user/py-pros/format-pi python examples/pi_graph.py
numpy.test())make.bat?Inspired by this post on StackOverflow.
FAQs
Format numbers as multiples of Pi
We found that matplot-fmt-pi demonstrated a healthy version release cadence and project activity because the last version was released less than a year ago. It has 1 open source maintainer collaborating on the project.
Did you know?

Socket for GitHub automatically highlights issues in each pull request and monitors the health of all your open source dependencies. Discover the contents of your packages and block harmful activity before you install or update your dependencies.
Research
A deceptive PyPI package posing as an Instagram growth tool collects user credentials and sends them to third-party bot services.

Product
Socket now supports pylock.toml, enabling secure, reproducible Python builds with advanced scanning and full alignment with PEP 751's new standard.

Security News
Research
Socket uncovered two npm packages that register hidden HTTP endpoints to delete all files on command.