
Research
Malicious fezbox npm Package Steals Browser Passwords from Cookies via Innovative QR Code Steganographic Technique
A malicious package uses a QR code as steganography in an innovative technique.
By Olivia Brown - Sep 22, 2025
Linear regression utility with inference tests, residual analysis, outlier visualization, multicollinearity test, and other features
pip install mlr)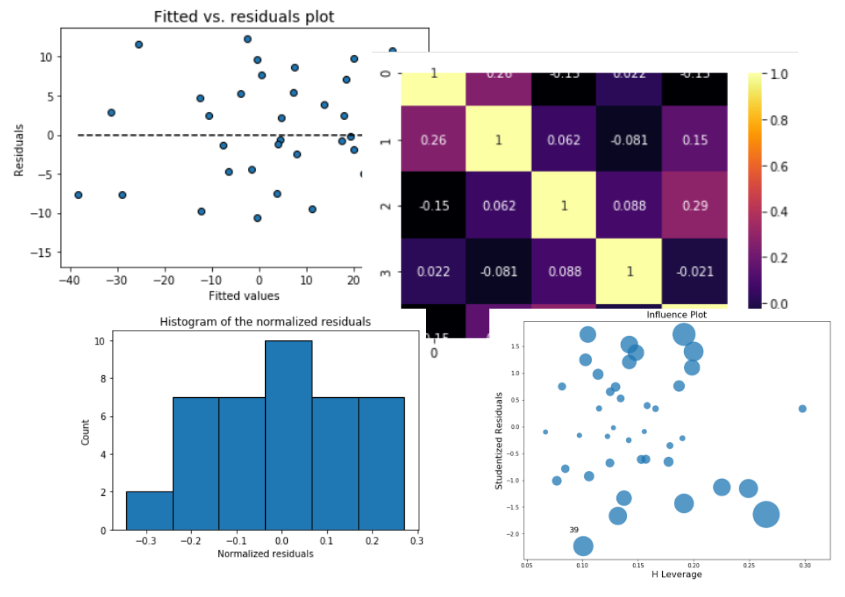
A lightweight, easy-to-use Python package that combines the scikit-learn-like simple API with the power of statistical inference tests, visual residual analysis, outlier visualization, multicollinearity test, found in packages like statsmodels and R language.
Authored and maintained by Dr. Tirthajyoti Sarkar (Website, LinkedIn profile)
pip install numpy)pip install pandas)pip install matplotlib)pip install seaborn)pip install scipy)pip install statsmodels)(On Linux and Windows) You can use pip
pip install mlr
(On Mac OS), first install pip,
curl https://bootstrap.pypa.io/get-pip.py -o get-pip.py
python get-pip.py
Then proceed as above.
Import the MyLinearRegression class,
from MLR import MyLinearRegression as mlr
import numpy as np
Generate some random data
num_samples=40
num_dim = 5
X = 10*np.random.random(size=(num_samples,num_dim))
coeff = np.array([2,-3.5,1.2,4.1,-2.5])
y = np.dot(coeff,X.T)+10*np.random.randn(num_samples)
Make a model instance,
model = mlr()
Ingest the data
model.ingest_data(X,y)
Fit,
model.fit()
You can read directly from a Pandas DataFrame. Just give the features/predictors' column names as a list and the target column name as a string to the fit_dataframe method.
At this point, only numerical features/targets are supported but in future releases we will support categorical variables too.
<... obtain a Pandas DataFrame by some processing>
df = pd.DataFrame(...)
feature_cols = ['X1','X2','X3']
target_col = 'output'

model = mlr()
model.fit_dataframe(X=feature_cols,y = target_col,dataframe=df)
So far, it looks similar to the linear regression estimator of Scikit-Learn, doesn't it?
Here comes the difference,
print ("R-squared: ",model.r_squared())
print ("Adjusted R-squared: ",model.adj_r_squared())
print("MSE: ",model.mse())

>> R-squared:  0.8344327025902752
   Adjusted R-squared:  0.8100845706182569
   MSE:  72.2107655649954
model.print_metrics()

>> sse:     2888.4306
   sst:     17445.6591
   mse:     72.2108
   r^2:     0.8344
   adj_r^2: 0.8101
   AIC:     296.6986
   BIC:     306.8319
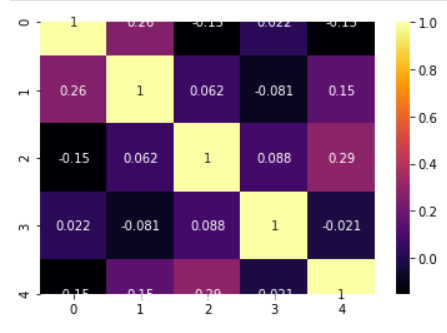
We can build the correlation matrix right after ingesting the data. This matrix gives us an indication how much multicollinearity is present among the features/predictors.
model.ingest_data(X,y)
model.corrcoef()

>> array([[ 1.        ,  0.18424447, -0.00207883,  0.144186  ,  0.08678109],
       [ 0.18424447,  1.        , -0.08098705, -0.05782733,  0.19119872],
       [-0.00207883, -0.08098705,  1.        ,  0.03602977, -0.17560097],
       [ 0.144186  , -0.05782733,  0.03602977,  1.        ,  0.05216212],
       [ 0.08678109,  0.19119872, -0.17560097,  0.05216212,  1.        ]])
model.covar()

>> array([[10.28752086,  1.51237819, -0.01770701,  1.47414685,  0.79121778],
       [ 1.51237819,  6.54969628, -0.5504233 , -0.47174359,  1.39094876],
       [-0.01770701, -0.5504233 ,  7.05247111,  0.30499622, -1.32560195],
       [ 1.47414685, -0.47174359,  0.30499622, 10.16072256,  0.47264283],
       [ 0.79121778,  1.39094876, -1.32560195,  0.47264283,  8.08036806]])
model.corrplot(cmap='inferno',annot=True)
It retunrs the F-statistic and the p-value of the test.
If the p-value is a small number you can reject the Null hypothesis that all the regression coefficient is zero. That means a small p-value (generally < 0.01) indicates that the overall regression is statistically significant.
model.ftest()

>> (34.270912591948814, 2.3986657277649282e-12)
Standard errors and corresponding t-tests give us the p-values for each regression coefficient, which tells us whether that particular coefficient is statistically significant or not (based on the given data).
print("P-values:",model.pvalues())
print("t-test values:",model.tvalues())
print("Standard errors:",model.std_err())

>> P-values: [8.33674608e-01 3.27039586e-03 3.80572234e-05 2.59322037e-01 9.95094748e-11 2.82226752e-06]
   t-test values: [ 0.21161008  3.1641696  -4.73263963  1.14716519  9.18010412 -5.60342256]
   Standard errors: [5.69360847 0.47462621 0.59980706 0.56580141 0.47081187 0.5381103 ]
model.conf_int()

>> array([[-10.36597959,  12.77562953],
       [  0.53724132,   2.46635435],
       [ -4.05762528,  -1.61971606],
       [ -0.50077913,   1.79891449],
       [  3.36529718,   5.27890687],
       [ -4.10883113,  -1.92168771]])
Residual analysis is crucial to check the assumptions of a linear regression model. mlr helps you check those assumption easily by providing straight-forward visual analytis methods for the residuals.
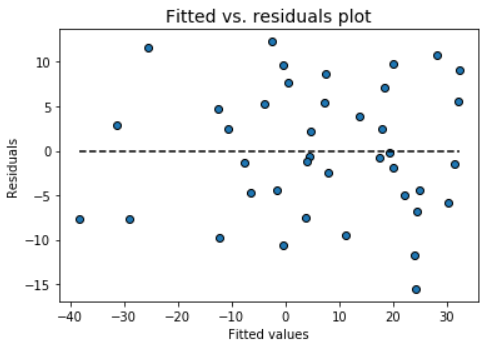
Check the assumption of constant variance and uncorrelated features (independence) with this plot
model.fitted_vs_residual()
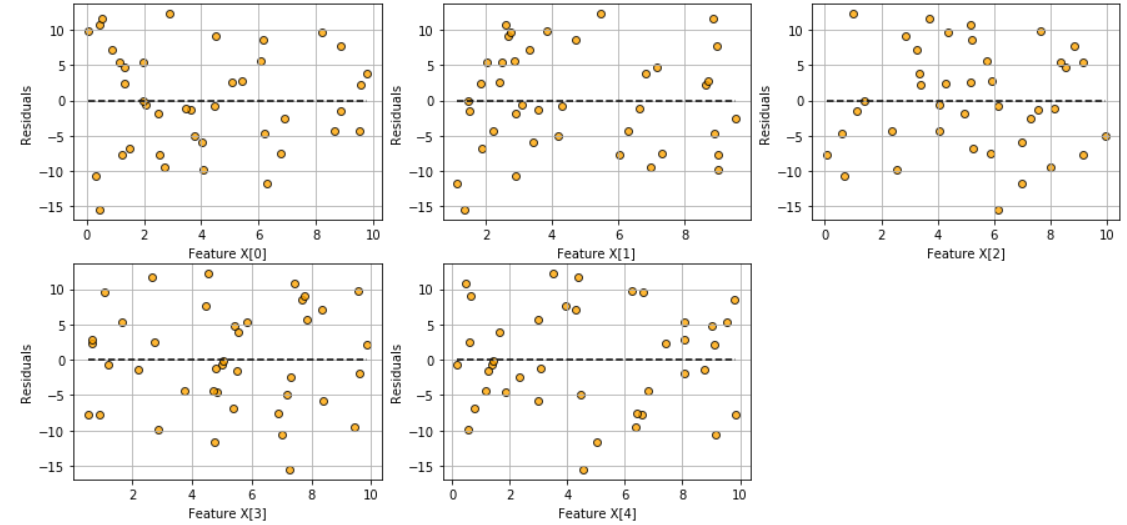
Check the assumption of linearity with this plot
model.fitted_vs_features()
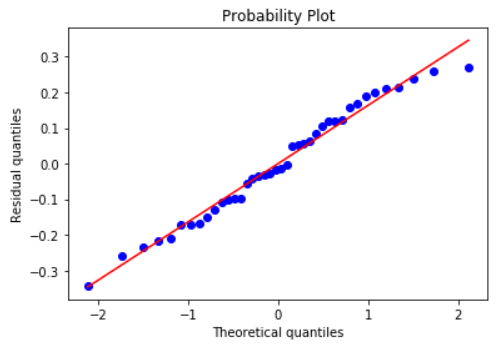
Check the normality assumption of the error terms using these plots,
model.histogram_resid()
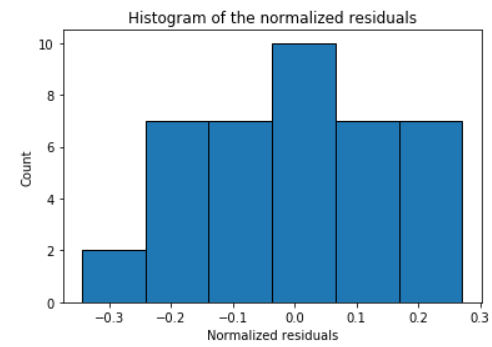
model.qqplot_resid()
Do more fun stuff with your regression model. More features will be added in the future releases!
FAQs
Linear regression utility with inference tests, residual analysis, outlier visualization, multicollinearity test, and other features
We found that mlr demonstrated a healthy version release cadence and project activity because the last version was released less than a year ago. It has 1 open source maintainer collaborating on the project.
Did you know?

Socket for GitHub automatically highlights issues in each pull request and monitors the health of all your open source dependencies. Discover the contents of your packages and block harmful activity before you install or update your dependencies.
Research
A malicious package uses a QR code as steganography in an innovative technique.

Research
/Security News
Socket identified 80 fake candidates targeting engineering roles, including suspected North Korean operators, exposing the new reality of hiring as a security function.
Application Security
/Research
/Security News
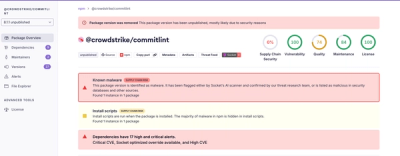
Socket detected multiple compromised CrowdStrike npm packages, continuing the "Shai-Hulud" supply chain attack that has now impacted nearly 500 packages.