
Research
Security News
The Growing Risk of Malicious Browser Extensions
Socket researchers uncover how browser extensions in trusted stores are used to hijack sessions, redirect traffic, and manipulate user behavior.
By Kush Pandya - Jun 13, 2025


mnqueues stands for Monitored Queues - a coupling between Python multiprocessing Queue() and a Monitor entity. A Monitor collect and alerts on Queue usage statistics.
mnqueues tracks several measures per queue:
To install mnqueues type:
pip install mnqueues
To create a monitored queue:
import mnqueues as mnq
from mnqueues.gcp_monitor import GCPMonitor

q = mnq.MNQueue(monitor=GCPMonitor("some-unique-name"))
The MNQueue() object encapsulated Python multiprocessing.Queue() and supports same functions. The MNQueue() object can be passed between processes, like a Queue() object.
from mnqueues.log_monitor import LOGMonitor

monitor = LOGMonitor("log-file-name")
Log all put() and get() calls to a log file with the the name log-file-name.log with the following format:
[<OS process-id>]->2021-07-07 21:31:14 INFO:get counter: 5003
[<OS process-id>]->2021-07-07 21:31:14 INFO:get counter: 4997
from mnqueues.gcp_monitor import GCPMonitor

monitor = GCPMonitor("unique-name")
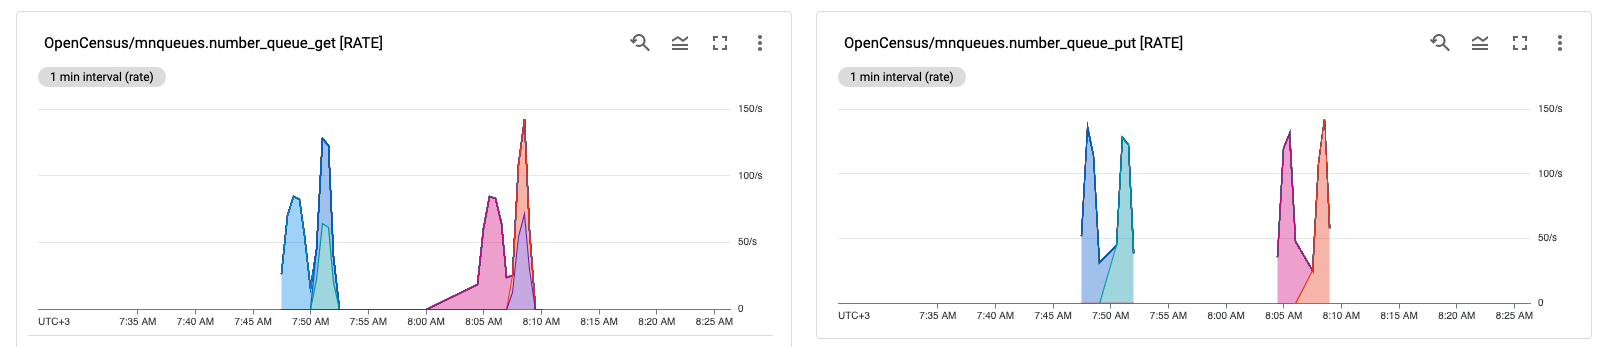
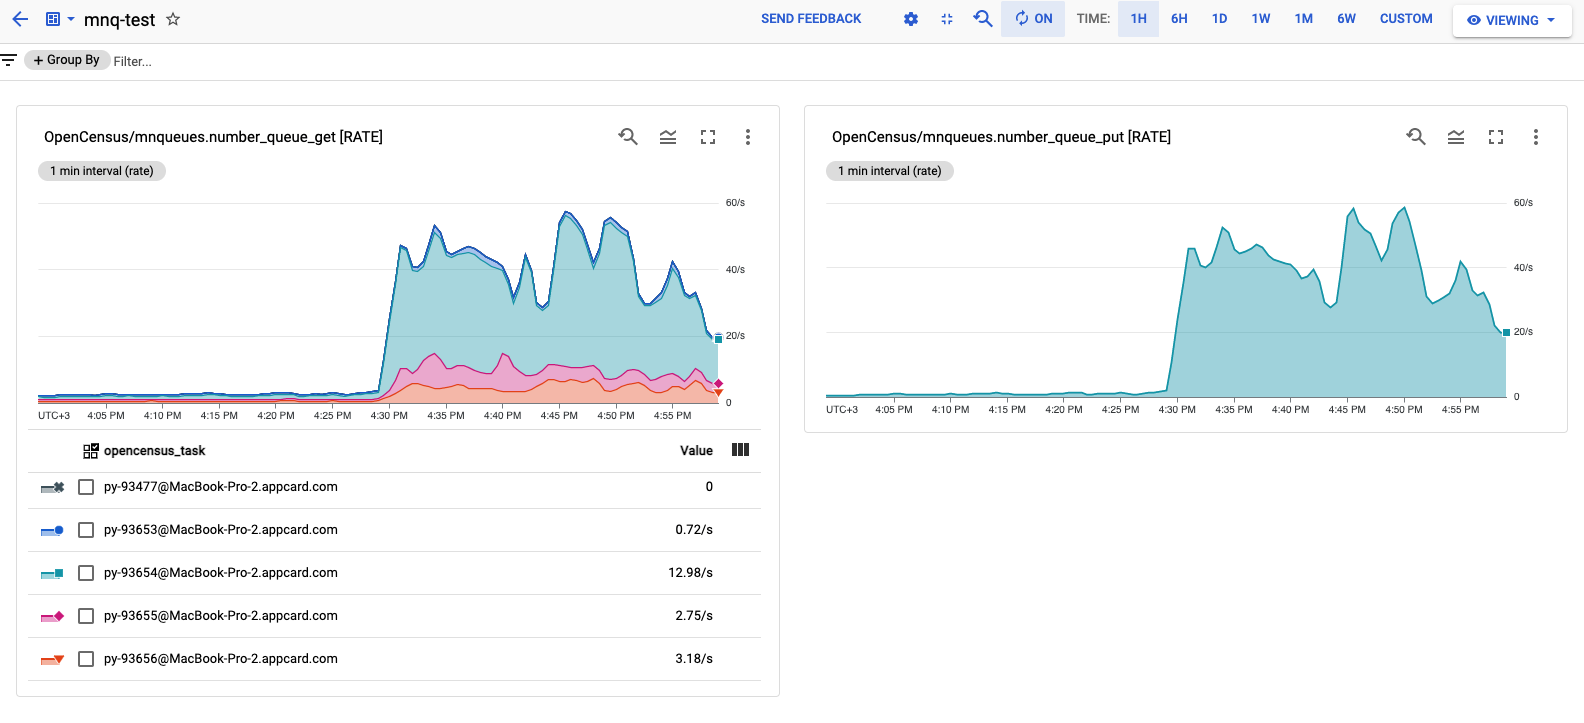
All calls to put() and get() are sent to Google Cloud Monitor. The Monitor class sends data to two custom measures:
OpenCensus/mnqueues.{name}.number_queue_get (line, no aggregation on GCP required)OpenCensus/mnqueues.{name}.number_queue_put (line, no aggregation on GCP required)OpenCensus/mnqueues.{name}.time_in_queue_distribution (heat-map with sum, shows latency distribution)Note that {name} is passed as a parameter when constructing the Monitor and it aims to assist in creating dash-boards for specific use-cases.
See for details.
pytest on the project tests folder.Can be found in the tests folder.
Contributions are highly appreciated. Please review our
Code of Conduct. Bug reports & feature requests can be left in the Issues section, or email me at amor71@sgeltd.com
FAQs
Monitored Multiprocessing Queues in Python
We found that mnqueues demonstrated a healthy version release cadence and project activity because the last version was released less than a year ago. It has 1 open source maintainer collaborating on the project.
Did you know?

Socket for GitHub automatically highlights issues in each pull request and monitors the health of all your open source dependencies. Discover the contents of your packages and block harmful activity before you install or update your dependencies.
Research
Security News
Socket researchers uncover how browser extensions in trusted stores are used to hijack sessions, redirect traffic, and manipulate user behavior.

Research
Security News
An in-depth analysis of credential stealers, crypto drainers, cryptojackers, and clipboard hijackers abusing open source package registries to compromise Web3 development environments.

Security News
pnpm 10.12.1 introduces a global virtual store for faster installs and new options for managing dependencies with version catalogs.