
Security News
Crates.io Users Targeted by Phishing Emails
The Rust Security Response WG is warning of phishing emails from rustfoundation.dev targeting crates.io users.
By Sarah Gooding - Sep 12, 2025
This package provides a Python implementation for calculating the Mixture Sequential Probability Ratio Test (mSPRT).
mSPRT is a statistical hypothesis test that can be used to decide if a observed data supports one of two hypotheses, based on a sequence of independent and identically distributed observations.
Main functionalities:
$$ \tau^2 = \sigma^2 \frac{\Phi(-b)}{\frac{1}{b}\phi(b)-\Phi(-b)} $$
$$ \tilde{\Lambda}_n = \sqrt{\frac{2\sigma^2}{V_n + n\tau^2}}\exp\left(\frac{n^2\tau^2(\bar{Y}_n - \bar{X}_n-\theta_0)^2}{4\sigma^2(2\sigma^2+n\tau^2)}\right). $$
$$ \tilde{\Lambda}_n = \sqrt{\frac{V_n}{V_n + n\tau^2}}\exp{\left(\frac{n^2\tau^2(\bar{Y}_n - \bar{X}_n-\theta_0)^2}{2V_n(V_n+n\tau^2)}\right)} $$
The mSPRT package can be easily installed using pip:
pip install msprt
Python >=3.10;<3.13
The mSPRT package depends on the following Python libraries:
These dependencies can also be easily installed using pip:
pip install numpy scipy matplotlib
First, import the mSPRT package:
import numpy as np
from msprt import msprt
Then, prepare the two sample lists that you want to compare.
np.random.seed(42)
n = 500
x = np.random.normal(0, 1, n)
y = np.random.normal(0.2, 1, n)
Next, call the msprt object with observation lists, along with the parameters for the mSPRT test, such as the alpha and the theta values (by default it assumes you are using a normal distribution and alpha is set to 0.05).
result = msprt(x=x, y=y, sigma=1.0)
print(result)
If you want to use a Bernoulli distribution, specify it as such:
result = msprt(x=x, y=y, theta=0.5, distribution='bernoulli')
print(result)
To plot the results, use the plot method:
result.plot()
For detailed information about each parameter, please refer to the comments in the source code.
If you find any problems with the implementation, you can leave the ticket on Github.
This project is free software; you can redistribute it and/or modify it under the terms of the GNU General Public License as published by the Free Software Foundation. See the LICENSE file for more information.
FAQs
Unknown package
We found that msprt demonstrated a healthy version release cadence and project activity because the last version was released less than a year ago. It has 1 open source maintainer collaborating on the project.
Did you know?

Socket for GitHub automatically highlights issues in each pull request and monitors the health of all your open source dependencies. Discover the contents of your packages and block harmful activity before you install or update your dependencies.
Security News
The Rust Security Response WG is warning of phishing emails from rustfoundation.dev targeting crates.io users.
Product
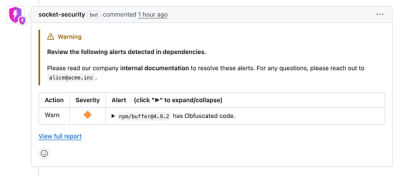
Socket now lets you customize pull request alert headers, helping security teams share clear guidance right in PRs to speed reviews and reduce back-and-forth.

Product
Socket's Rust support is moving to Beta: all users can scan Cargo projects and generate SBOMs, including Cargo.toml-only crates, with Rust-aware supply chain checks.