NAIS Processor
Code package to process NAIS (Neutral cluster and Air Ion Spectrometer, Airel Ltd.) data files.
Installation
pip install nais-processor
You can find the package on PyPI.
Documentation
See here
Modules
Processor
The nais.processor module can be used to process the data to netcdf files and allows options for the following operations:
- Inlet loss correction (Gromley and Kennedy, 1948)
- Ion mode correction (Wagner et al. 2016)
- Conversion to standard conditions (293.15 K, 101325 Pa)
- Remove charger ion band from total particle data
- Use fill values in case of missing environmental sensor data
Utils
The nais.utils module contains functions that allow one to do operations on the NAIS data files.
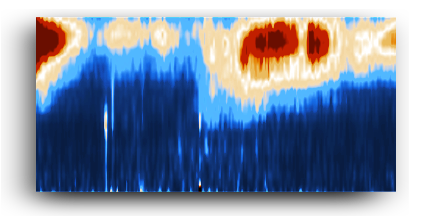
Checker
The nais.checker module contains a GUI application with which one can visually inspect the nais ion/aerosol size distributions along with the flags and identify bad data by drawing a bounding box around it and saving the coordinates for later use.
(Tested with Qt vers. 5.15.2)
Example usage
Use the make_config_template() method to create a configuration file template and fill it with necessary information. The configuration file is used at processing the data files.
from nais.processor import make_config_template
make_config_template("/home/user/viikki.yml")
Running this will create a configuration file template called /home/user/viikki.yml. After filling in the information in the confguration file for our example measurement the file may look like this:
measurement_location: Viikki, Helsinki, Finland
description: Agricultural site
longitude: 25.02
latitude: 60.23
data_folder:
- /home/user/data/2021
- /home/user/data/2022
processed_folder: /home/user/viikki
database_file: /home/user/viikki.json
start_date: 2022-09-28
end_date: 2022-09-30
inlet_length: 1.0
do_inlet_loss_correction: true
convert_to_standard_conditions: true
do_wagner_ion_mode_correction: true
remove_corona_ions: true
allow_reprocess: false
redo_database: false
fill_temperature: 273.15
fill_pressure: 101325.0
fill_flowrate: 54.0
dilution_on: false
file_format: block
resolution: 5min
Then process the data files by running nais_processor() method with the config file as the input argument.
In our example case:
from nais.processor import nais_processor
nais_processor("/home/user/viikki.yml")
Building database...
Processing 20220928 (Viikki, Helsinki, Finland)
Processing 20220929 (Viikki, Helsinki, Finland)
Processing 20220930 (Viikki, Helsinki, Finland)
Done!
The code produces daily processed data files NAIS_yyyymmdd.nc (netCDF format). These files are saved in the destination given in the configuration file.
The locations of raw and processed files for each day are written in the JSON formatted database_file. This prevents reprocessing when allow_reprocess: false.
The netcdf files have the following structure:
| Coordinates | | | | |
| time | time | datetime64[ns] | | timezone: utc |
| diameter | diameter | float | m | particle diameter |
| flag | flag | string | | |
| Data variables | | | | |
| neg_ions | time,diameter | float | cm-3 | dN/dlogDp |
| pos_ions | time,diameter | float | cm-3 | dN/dlogDp |
| neg_particles | time,diameter | float | cm-3 | dN/dlogDp |
| pos_particles | time,diameter | float | cm-3 | dN/dlogDp |
| neg_ion_flags | time,flag | int | | flag=1, no flag=0 |
| pos_ion_flags | time,flag | int | | flag=1, no flag=0 |
| neg_particle_flags | time,flag | int | | flag=1, no flag=0 |
| pos_particle_flags | time,flag | int | | flag=1, no flag=0 |
| temperature | time | float | K | |
| pressure | time | float | Pa | |
| sample_flow | time | float | lpm | |
| Attributes | | | | |
| Measurement info | | dictionary | | |
Below are some examples of how to access the different variables in the netcdf file.
import xarray as xr
import pandas as pd
ds = xr.open_dataset("/home/user/viikki/NAIS_20220928.nc")
df_neg_ions = ds.neg_ions.to_pandas()
df_temperature = ds.temperature.to_pandas()
ds.close()
Continuing on with the data analysis, next we combine the previously created files into a single continuous dataset with 1 hour time resolution and only raise a flag if at least 50% of the data points inside the two hour window contain the flag. We save it as a netcdf file.
from nais.utils import combine_data
import pandas as pd
import xarray as xr

data_source = "/home/user/viikki"
date_range = pd.date_range("2022-09-28","2022-09-30")

ds = combine_data(data_source, date_range, "1H",
    flag_sensitivity=0.5)

ds.to_netcdf("combined_nais_dataset.nc")
Then we launch the data checker with the combined data in order to identify bad data. Bounding boxes can be drawn around bad data in the size distributions (initiate an adjustable box with double left click and remove from the menu opened by right clicking the box). By clicking the save boundaries button the box coordinates are saved to a netcdf file (filename given in the second argument). If the bounding boxes are saved, they will be reloaded when the checker is reopened with same arguments, so save your work regularly in case the program crashes.
from nais.checker import startNaisChecker
startNaisChecker("combined_nais_dataset.nc", "bad_data_bounds.nc")
We can set the bad data to NaN in our combined file and use the resulting dataset as the starting point for further analysis.
from nais.utils import remove_bad_data

ds = xr.open_dataset("combined_nais_dataset.nc")
bad_data = xr.open_dataset("bad_data_bounds.nc")
ds = remove_bad_data(ds, bad_data)
License
This project is licensed under the terms of the GNU GPLv3.
References
Gormley P. G. and Kennedy M., Diffusion from a Stream Flowing through a Cylindrical Tube, Proceedings of the Royal Irish Academy. Section A: Mathematical and Physical Sciences, 52, (1948-1950), pp. 163-169.
Wagner R., Manninen H.E., Franchin A., Lehtipalo K., Mirme S., Steiner G., Petäjä T. and Kulmala M., On the accuracy of ion measurements using a Neutral cluster and Air Ion Spectrometer, Boreal Environment Research, 21, (2016), pp. 230–241.


