NDVisualizer
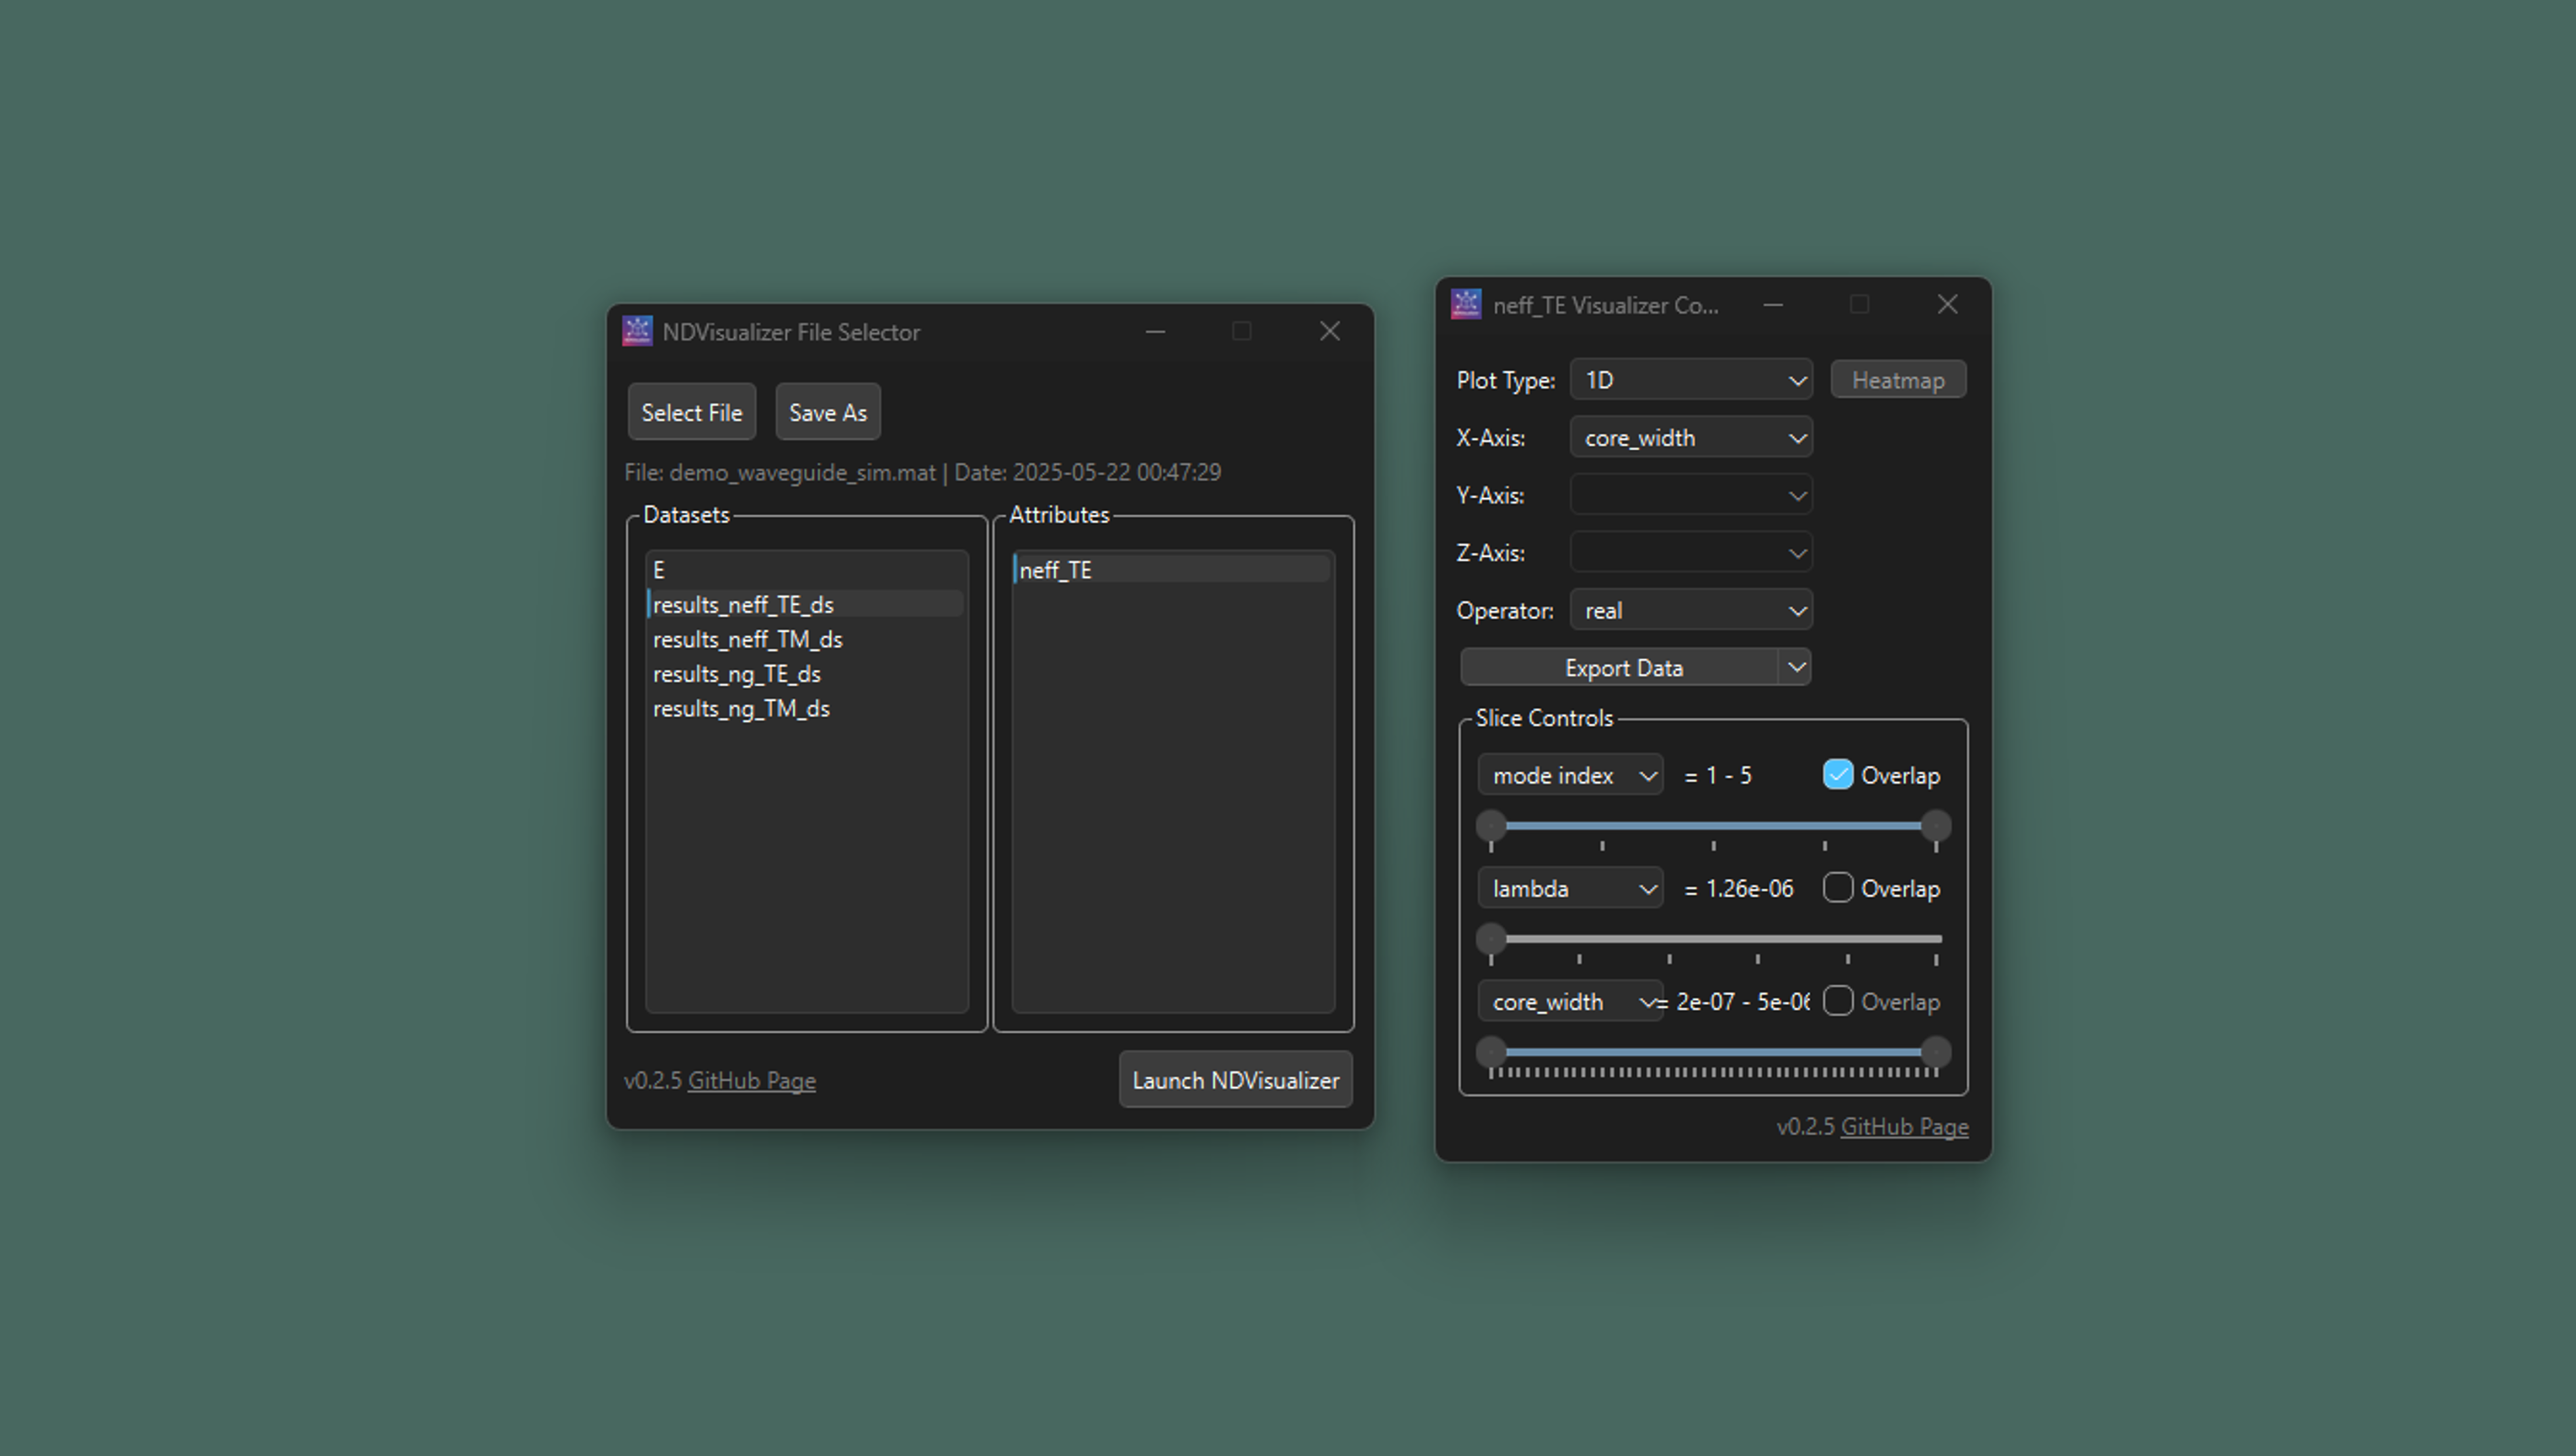
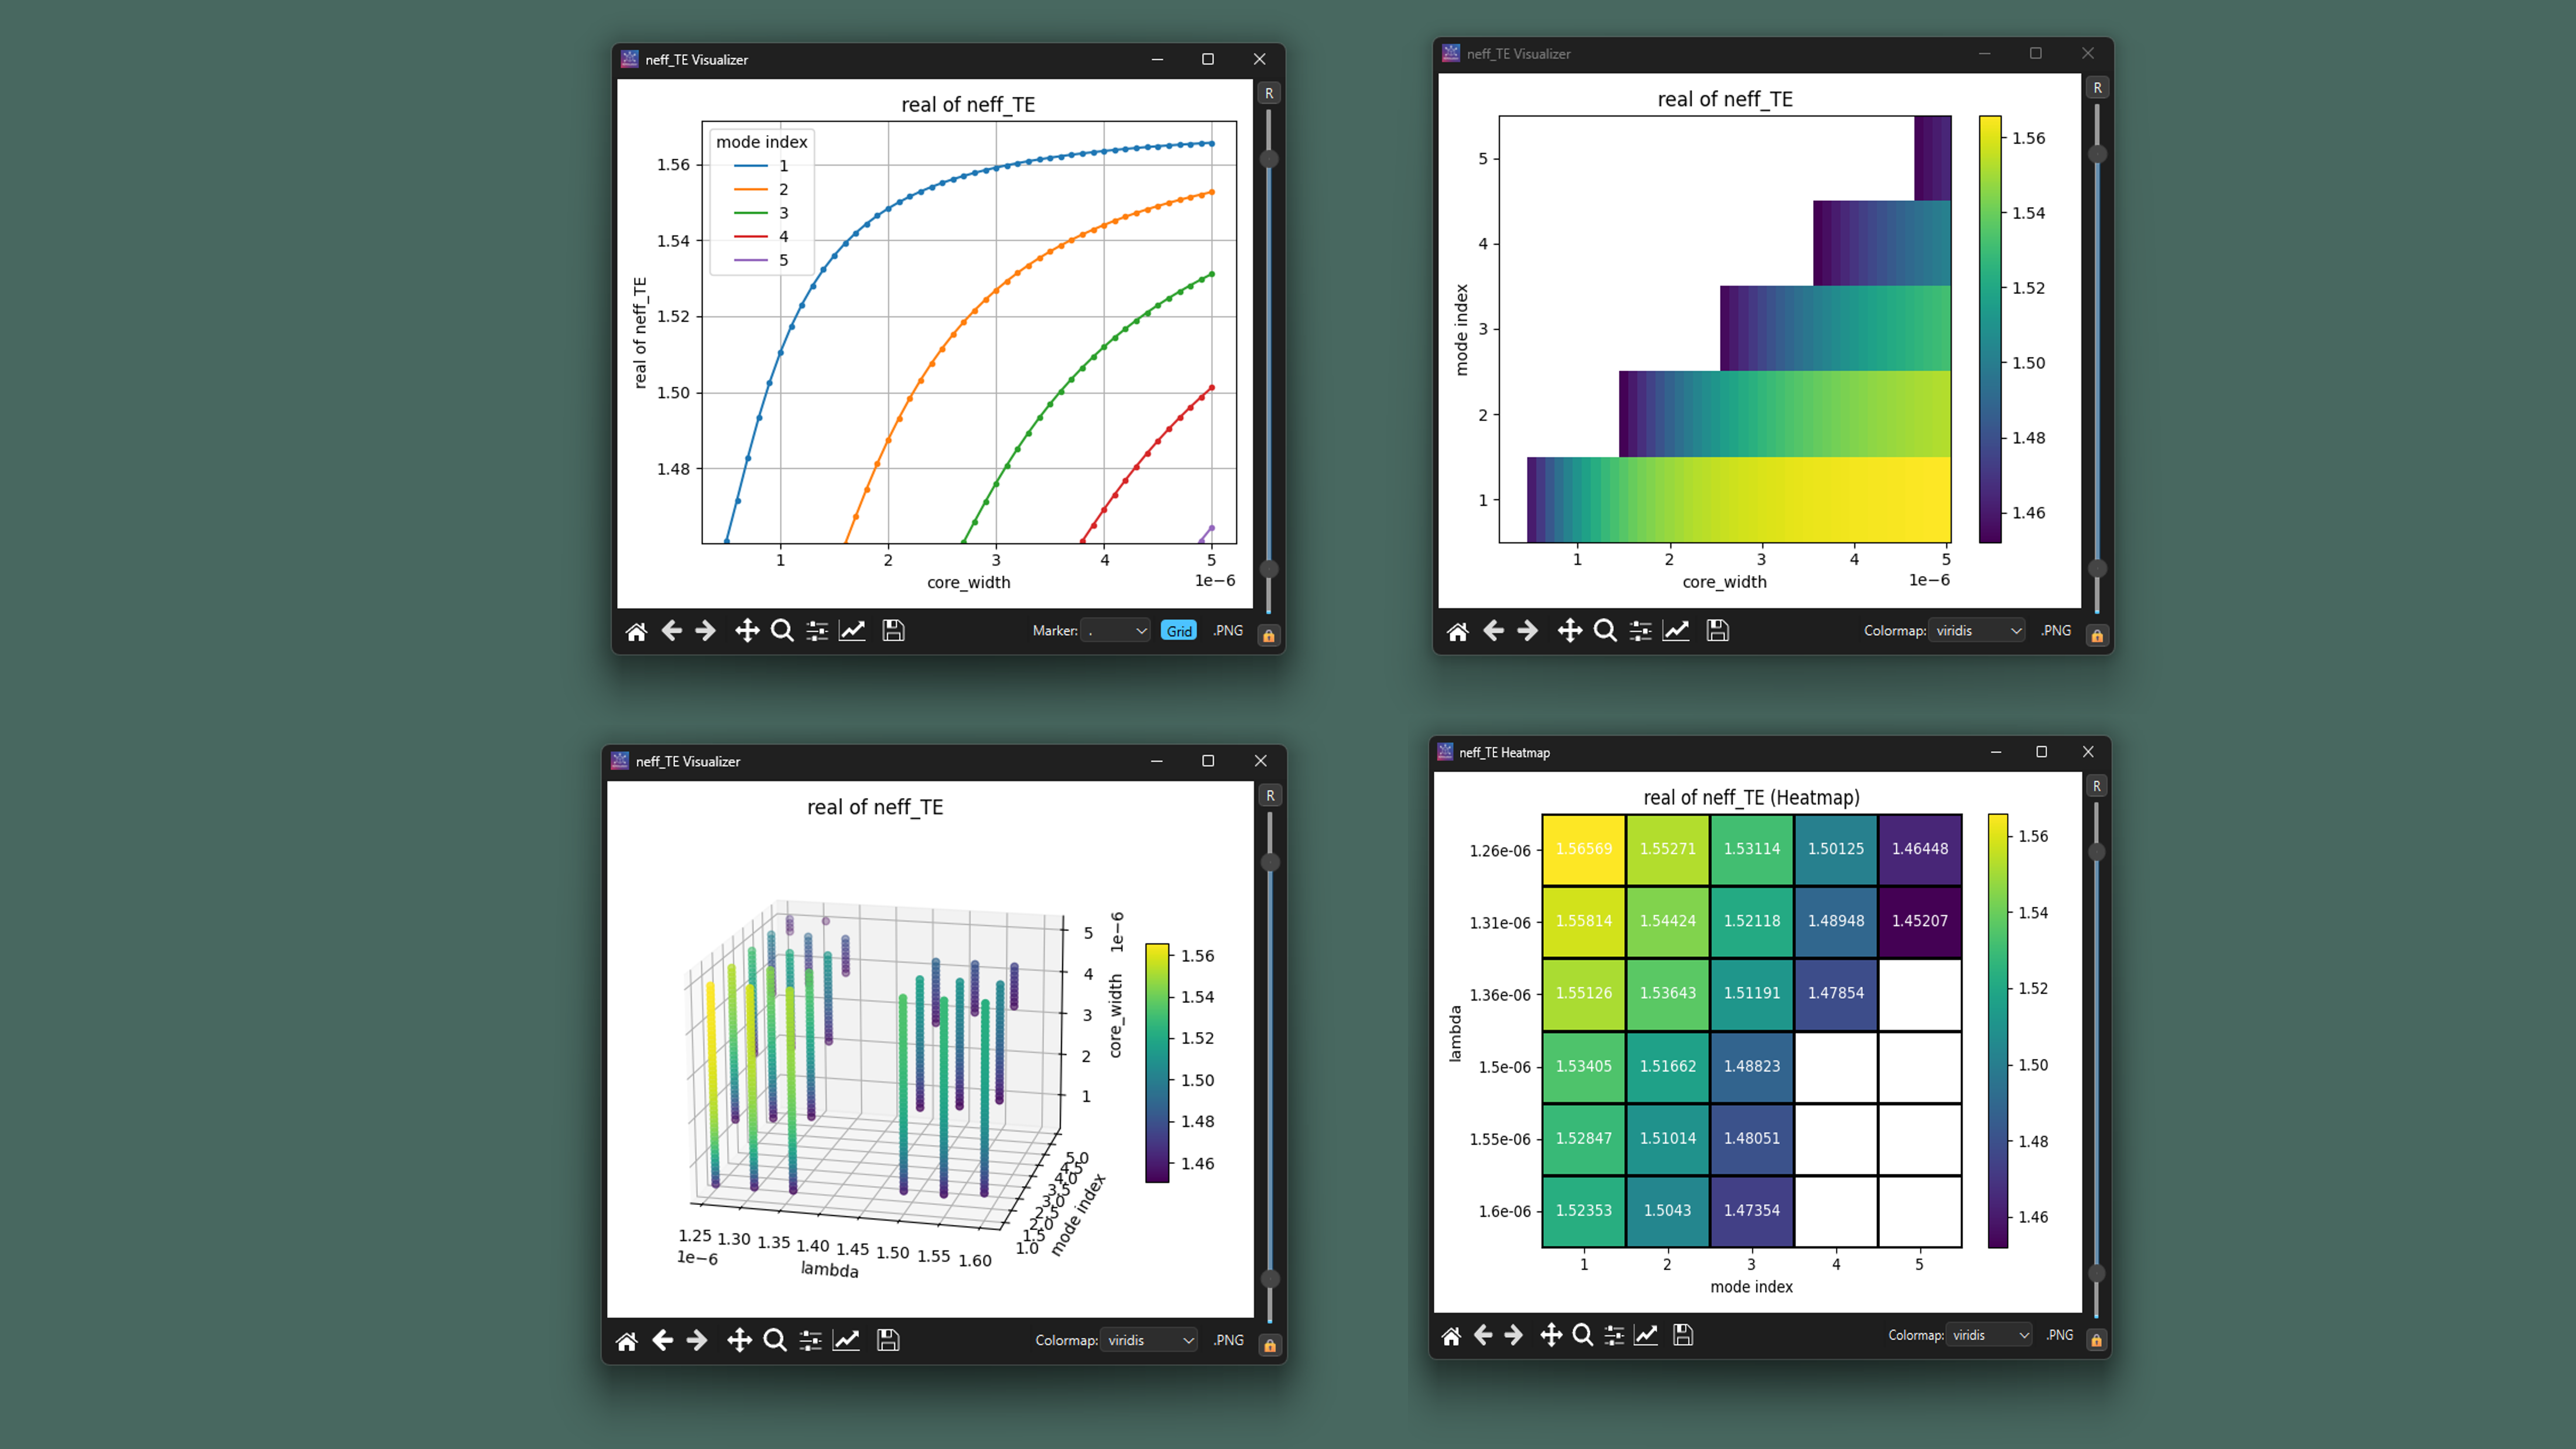
NDVisualizer (N-Dimensional Visualizer) is a high-dimensional data exploration tool that allows you to slice and visualize datasets in 1-D, 2-D, and 3-D representations, and produce professional grade figures for publications and presentations.
This tool was developed as a free, lightweight alternative for inspecting simulation datasets generated by the Ansys Lumerical® Suite. Based on my research, no existing tool served this specific purpose—please let me know if you are aware of any.
NDVisualizer currently supports matrix and rectilinear datasets saved in Matlab® data files (.mat). It can also be used to visualize any datasets with the same structure. An converter is included for loading CSV file with multi-dimensional support.
Suggestions and contributions are welcome!
Features
- Visualize and slice high-dimensional data
- Support for:
- 1D, 2D, and 3D plots
- Interactive data exploration
- Free and Lightweight
Supported Formats
NDVisualizer currently supports:
-
Lumerical® Matrix and rectilinear datasets saved in MATLAB® data format .mat, as well as MATLAB® data file containing datasets with compatible data structure.
Lumerical Rectilinear Dataset structure:
{
  "dataset": {
    "parameters": [
      {
        "variable": ["var_name1", "var_name2", ...],
        "name": ["disp_name1", "disp_name2", ...]
      },
      ...
    ],
    "attributes": [
      {
        "variable": ["attr_name1", "attr_name2", ...],
        "name": ["disp_attr_name1", "disp_attr_name1", ...]
      },
      ...
    ]
  },

  "attr_name1": <attr1_data array>,
  "attr_name2": <attr2 data array>,
  ...
  "var_name1": <var1 data array>,
  "var_name2": <var1 data array>,
  ...
}
-
Comma-Separated Values (.csv) file
-
Support of more data format is comming soon.
Installation
Standalone Executable
An standalone executable file for Windows is available for easy use (compiled with Nuitka). Download the latest release here:
NDVisualizer Releases
Using pip
Install NDVisualizer from PyPI:
pip install ndvis
This will install NDVisualizer and the dependencies.
Run:
python -m ndvis
Run from source code
Download the scource code or clone the repository, then install the dependencies
pip install -r requirements.txt
and run
python NDVisualizer_run.py
Development Installation
For development or to get the latest features:
git clone https://github.com/yuanliu-repo/NDVisualizer_py.git
cd NDVisualizer_py
pip install -e .
Changelogs
v0.2.5
- add .csv file importor
- copy data to clipboard or export .csv or .mat file
- add controls for plots (colorbar and y-axis range control, save and copy plot, change line styles and colormaps, add grid to plot, etc).
- enhance heatmap plots
- other bug fixes
- modularize the source code and upload to PyPI
v0.2.4
Contributions
Suggestions, issues, and pull requests are welcome! Feel free to open an issue or contribute directly.