Research
Security News
Lazarus Strikes npm Again with New Wave of Malicious Packages
The Socket Research Team has discovered six new malicious npm packages linked to North Korea’s Lazarus Group, designed to steal credentials and deploy backdoors.
utilities for debugging of python scripts. prints stack backtraces that look similar to gdb stacktrace (gdb commands bt and bt full); can be used instead of traceback.
Written by Michael Moser (c) 2015
this project on pypi link
Functions
die(*msg)
receives a variable number of arguments; prints each argument (with pprint) to standard error stream,
shows a detailed stack trace (also to standard error, see print_stack_ex, does not follow objects (follow_objects = 0);
exit program with error (status 1)
this is similar to die built in function in perl
die2(*msg)
receives a variable number of arguments; prints each argument (with pprint) to standard error stream,
shows a detailed stack trace (also to standard error, see print_stack_ex, does follow objects (follow_objects = 1);
exit program with error (status 1)
this is similar to die built in function in perl
print_exception_ex(follow_objects=0, file=None)
prints an exception with more detailed stack trace, is used as follows:
the function is similar to traceback.print_exception , just with more detailed stack trace
import pd
try:
<python code>
except BaseException:
pd.print_exception_ex()
parameters:
follow_objects - if not 0 then representation of object values is printed
Please note that follow_objects=1 can generate a lot of output, and can take a lot of time. (default 0)
file - print to file (default value None - print to standard error stream)
example stack trace:
Exception: got it
#1 def kuku2(self = {'a': 42, 'b': [1, 2, 3, 4]}, depth = 1) at test_pd.py:29
Calls next frame at:
raise Exception('got it') at: test_pd.py:29
#2 def kuku2(self = {'a': 42, 'b': [1, 2, 3, 4]}, depth = 2) at test_pd.py:28
Calls next frame at:
kuku2( depth - 1 ) at: test_pd.py:28
#3 def kuku2(self = {'a': 42, 'b': [1, 2, 3, 4]}, depth = 3) at test_pd.py:28
Calls next frame at:
kuku2( depth - 1 ) at: test_pd.py:28
#4 def kuku2(self = {'a': 42, 'b': [1, 2, 3, 4]}, depth = 4) at test_pd.py:28
Calls next frame at:
kuku2( depth - 1 ) at: test_pd.py:28
#5 def kuku2(self = {'a': 42, 'b': [1, 2, 3, 4]}, depth = 5) at test_pd.py:28
Calls next frame at:
kuku2( depth - 1 ) at: test_pd.py:28
#6 def kuku2(self = {'a': 42, 'b': [1, 2, 3, 4]}, depth = 6) at test_pd.py:28
Calls next frame at:
kuku2( depth - 1 ) at: test_pd.py:28
#7 def main() at test_pd.py:44
Local variables:
n = {'a': 42, 'b': [1, 2, 3, 4]}
Calls next frame at:
pd.print_exception_ex( follow_objects = 1 ) at: test_pd.py:44
print_stack_ex(skipframes=0, follow_objects=0, file=None, frame=None)
print stack trace from an arbitrary point in the program;
the function is similar to traceback.print_stack , just with more detailed stack trace
the stack trace includes function names, values of parameters and values of local variables. i find it easier to debug with this stack trace.
parameters:
skipframes - skip a number of frames if is not 0 (default 0)
follow_objects - if not 0 then representation of object values is printed
Please note that follow_objects=1 can generate a lot of output, and can take a lot of time. (default 0)
file - print to file (default value None - print to standard error stream)
frame - specify a start frame (default None - show from calling function; deepest frame on top marked with #1)
this function is similar to traceback.print_stack , just with more detailed stack trace.
works for python 2.7, should work for other versions as well
example stack trace:
#1 def fact(n = 1) at test_pd.py:10
Local variables:
loc 2
loc2 [0]
Calls next frame at:
pd.print_stack_ex() at: test_pd.py:10
#2 def fact(n = 2) at test_pd.py:8
Local variables:
loc 4
loc2 [0, 1]
Calls next frame at:
return n * fact( n - 1 ) at: test_pd.py:8
#3 def fact(n = 3) at test_pd.py:8
Local variables:
loc 6
loc2 [0, 1, 2]
Calls next frame at:
return n * fact( n - 1 ) at: test_pd.py:8
#4 def fact(n = 4) at test_pd.py:8
Local variables:
loc 8
loc2 [0, 1, 2, 3]
Calls next frame at:
return n * fact( n - 1 ) at: test_pd.py:8
#5 def main() at test_pd.py:36
Local variables:
Calls next frame at:
print fact(4) at: test_pd.py:36
#6 def <module>() at test_pd.py:53
Calls next frame at:
main() at: test_pd.py:53
FAQs
more detailed python backtraces (similar to backtrace module)
We found that pd demonstrated a healthy version release cadence and project activity because the last version was released less than a year ago. It has 1 open source maintainer collaborating on the project.
Did you know?

Socket for GitHub automatically highlights issues in each pull request and monitors the health of all your open source dependencies. Discover the contents of your packages and block harmful activity before you install or update your dependencies.

Research
Security News
The Socket Research Team has discovered six new malicious npm packages linked to North Korea’s Lazarus Group, designed to steal credentials and deploy backdoors.

Security News
Socket CEO Feross Aboukhadijeh discusses the open web, open source security, and how Socket tackles software supply chain attacks on The Pair Program podcast.

Security News
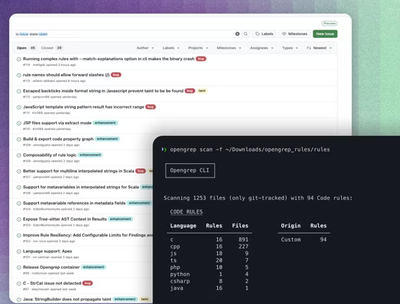
Opengrep continues building momentum with the alpha release of its Playground tool, demonstrating the project's rapid evolution just two months after its initial launch.