Gantt Chart Creator for MSCA Fellowship
- This Python application creates a high-quality Gantt chart to visualize project timelines, work packages, milestones, and deliverables. It uses Plotly for interactive visualization and supports exporting the chart as a PNG image. The tool is tailored for projects, such as those funded by the Marie Skłodowska-Curie Actions (MSCA) fellowship.
Features
- Interactive Gantt chart creation.
- Customizable colors for milestones and deliverables.
- Annotations for explaining work packages.
- Option to save the chart as a high-quality PNG file.
Installation
To use this application, you need to have Python installed. You also need the following Python packages:
- You can install these packages using pip:
pip install plotly kaleido
Usage
- To create a Gantt chart, call the create_gantt_chart function with the appropriate parameters.
Function Signature
def create_gantt_chart(work_packages, milestone_color, deliverable_color, annotation_text, start_date, finish_date, project_title, save=False):
Parameters
- work_packages: List of dictionaries, each representing a task with 'Task', 'Start', 'Finish', and 'Type'.
- milestone_color: Color code (e.g., hex color) for milestones.
- deliverable_color: Color code (e.g., hex color) for deliverables.
- annotation_text: Text for the annotation explaining work packages.
- start_date: Start date for the x-axis in 'YYYY-MM-DD' format.
- finish_date: Finish date for the x-axis in 'YYYY-MM-DD' format.
- project_title: Title of the project to be displayed at the top of the chart.
- save: Boolean, if True, the chart is saved as a high-quality PNG file.
Contact
- Email:
pejman.ebrahimi77@gmail.com
- Website:
https://giltech-megoldasok.com/
License
- This project is licensed under the MIT License
Example output
- Here is an example of how to use the create_gantt_chart function:
Gantt Chart Example code and inputs
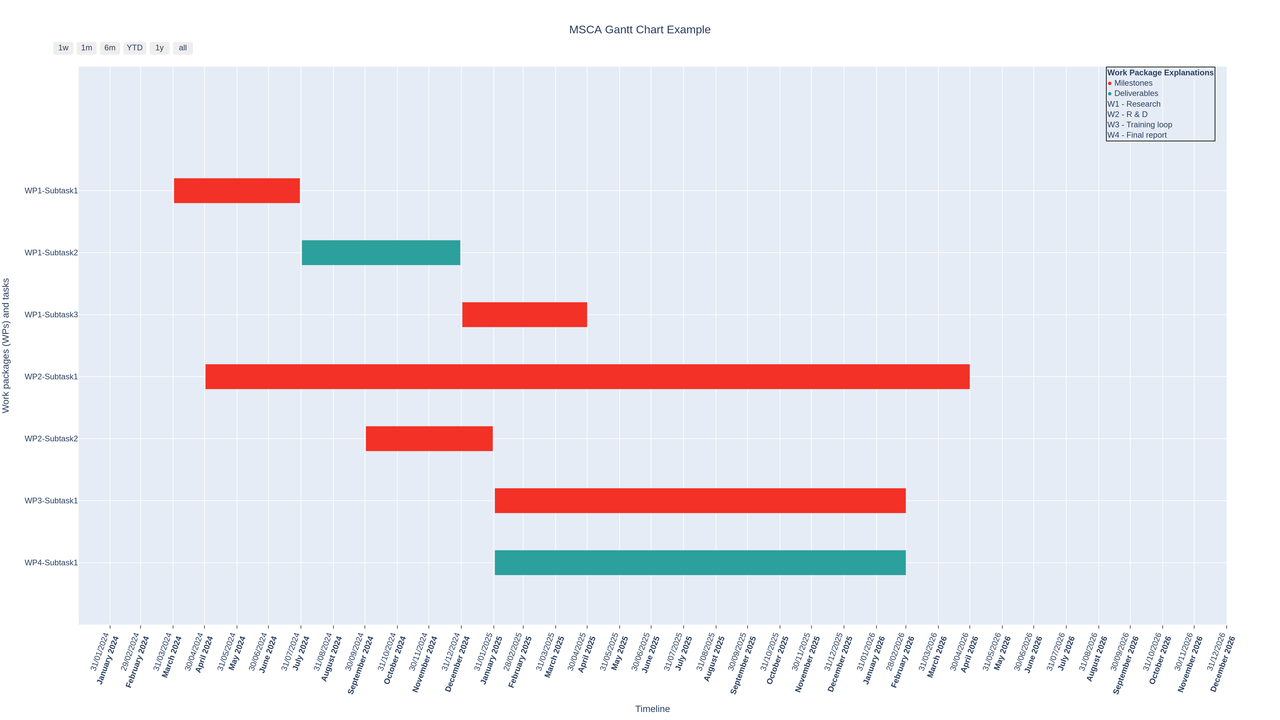
Below is an example of how to use the create_gantt_chart function from the pejmanai_msca.gantt_chart module:
from pejmanai_msca.gantt_chart import create_gantt_chart
work_packages = [
{"Task": "WP1-Subtask1", "Start": "2024-04-01", "Finish": "2024-07-30", "Type": "M1"},
{"Task": "WP1-Subtask2", "Start": "2024-08-01", "Finish": "2024-12-30", "Type": "D1"},
{"Task": "WP1-Subtask3", "Start": "2025-01-01", "Finish": "2025-04-30", "Type": "M2"},
{"Task": "WP2-Subtask1", "Start": "2024-05-01", "Finish": "2026-04-30", "Type": "M3"},
{"Task": "WP2-Subtask2", "Start": "2024-10-01", "Finish": "2025-01-30", "Type": "M4"},
{"Task": "WP3-Subtask1", "Start": "2025-02-01", "Finish": "2026-02-28", "Type": "M5"},
{"Task": "WP4-Subtask1", "Start": "2025-02-01", "Finish": "2026-02-28", "Type": "D2"}
]
milestone_color = '#f33126'
deliverable_color = '#2ca09c'
annotation_text = (
"<span style='color:#f33126;'>●</span> Milestones<br>"
"<span style='color:#2ca09c;'>●</span> Deliverables<br>"
"W1 - Research<br>"
"W2 - R & D<br>"
"W3 - Training loop<br>"
"W4 - Final report"
)
project_title = "MSCA Gantt Chart Example"
create_gantt_chart(work_packages, milestone_color, deliverable_color, annotation_text, '2024-01-01', '2026-12-31', project_title, save=True)```