Security News
Meet Socket at Black Hat and DEF CON 2025 in Las Vegas
Meet Socket at Black Hat & DEF CON 2025 for 1:1s, insider security talks at Allegiant Stadium, and a private dinner with top minds in software supply chain security.
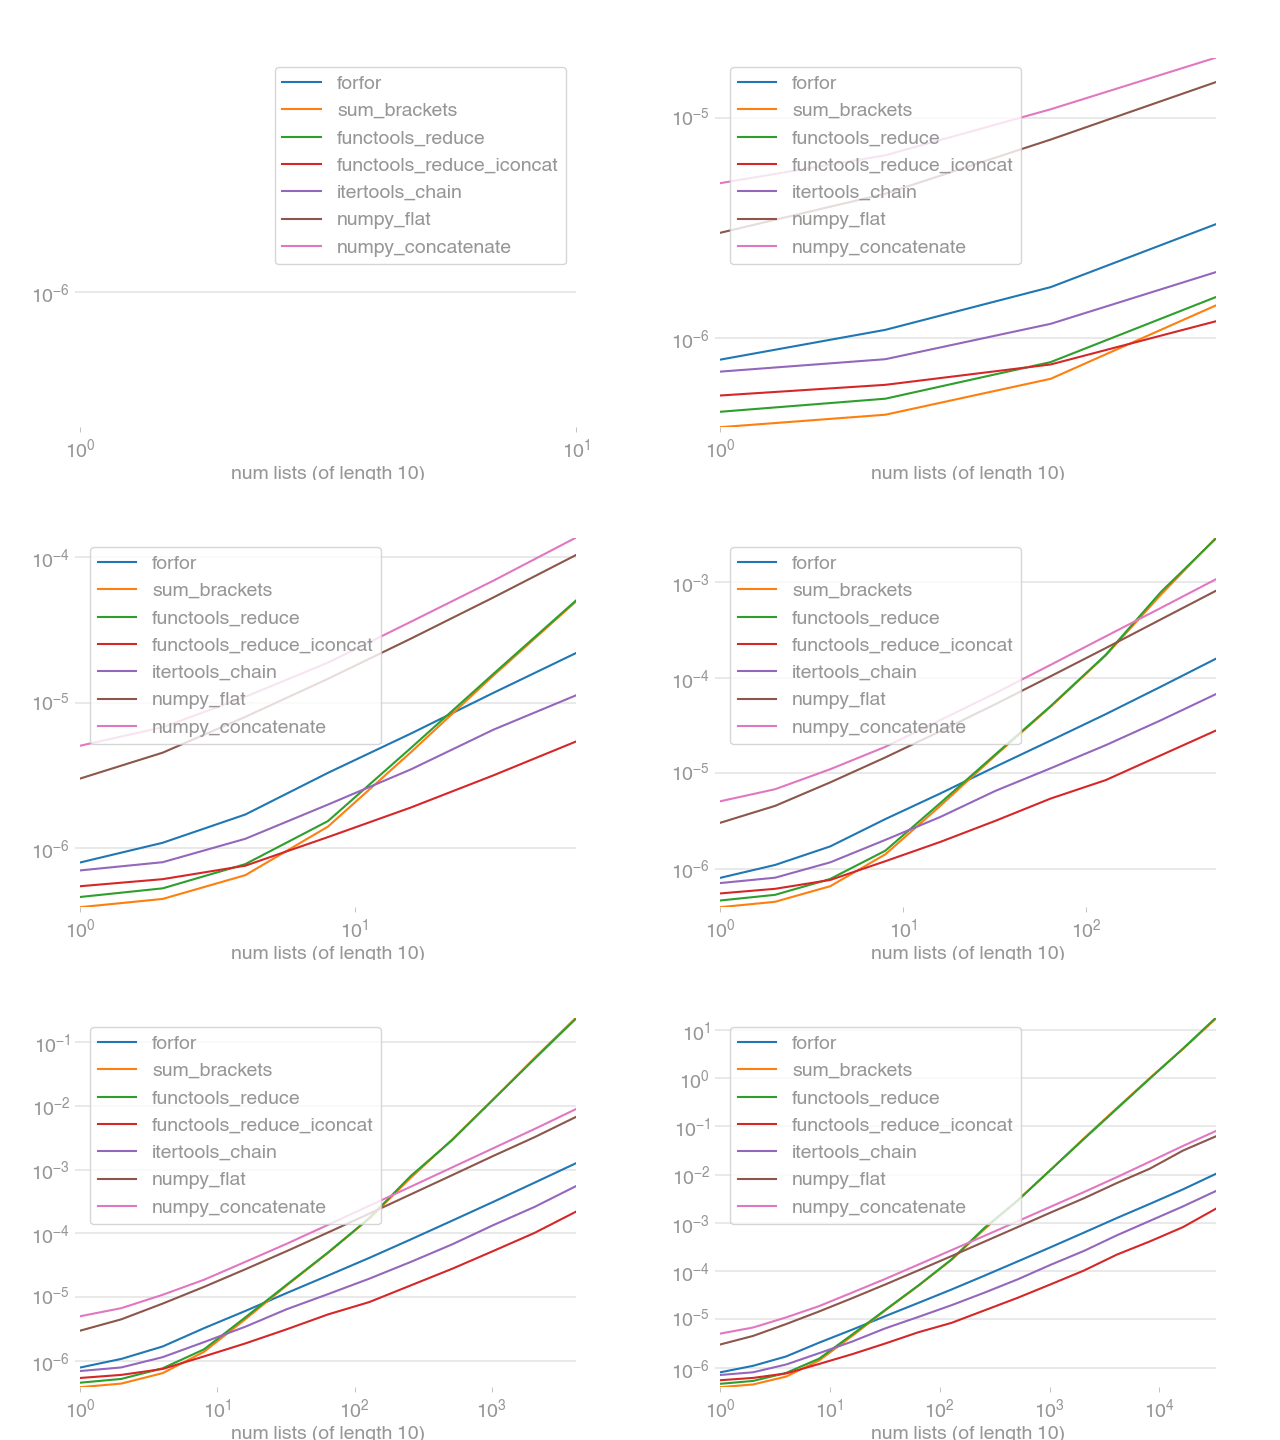
perfplot extends Python's timeit by testing snippets with input parameters (e.g., the size of an array) and plotting the results.
For example, to compare different NumPy array concatenation methods, the script
import numpy as np
import perfplot
perfplot.show(
setup=lambda n: np.random.rand(n), # or setup=np.random.rand
kernels=[
lambda a: np.c_[a, a],
lambda a: np.stack([a, a]).T,
lambda a: np.vstack([a, a]).T,
lambda a: np.column_stack([a, a]),
lambda a: np.concatenate([a[:, None], a[:, None]], axis=1),
],
labels=["c_", "stack", "vstack", "column_stack", "concat"],
n_range=[2**k for k in range(25)],
xlabel="len(a)",
# More optional arguments with their default values:
# logx="auto", # set to True or False to force scaling
# logy="auto",
# equality_check=np.allclose, # set to None to disable "correctness" assertion
# show_progress=True,
# target_time_per_measurement=1.0,
# max_time=None, # maximum time per measurement
# time_unit="s", # set to one of ("auto", "s", "ms", "us", or "ns") to force plot units
# relative_to=1, # plot the timings relative to one of the measurements
# flops=lambda n: 3*n, # FLOPS plots
)
produces
Clearly, stack and vstack are the best options for large arrays.
(By default, perfplot asserts the equality of the output of all snippets, too.)
If your plot takes a while to generate, you can also use
perfplot.live(
    # ...
)

with the same arguments as above. It will plot the updates live.
Benchmarking and plotting can be separated. This allows multiple plots of the same data, for example:
out = perfplot.bench(
    # same arguments as above (except the plot-related ones, like time_unit or log*)
)
out.show()
out.save("perf.png", transparent=True, bbox_inches="tight")
Other examples:
perfplot is available from the Python Package Index, so simply do
pip install perfplot
to install.
To run the perfplot unit tests, check out this repository and type
tox
This software is published under the GPLv3 license.
FAQs
Performance plots for Python code snippets
We found that perfplot demonstrated a healthy version release cadence and project activity because the last version was released less than a year ago. It has 1 open source maintainer collaborating on the project.
Did you know?

Socket for GitHub automatically highlights issues in each pull request and monitors the health of all your open source dependencies. Discover the contents of your packages and block harmful activity before you install or update your dependencies.

Security News
Meet Socket at Black Hat & DEF CON 2025 for 1:1s, insider security talks at Allegiant Stadium, and a private dinner with top minds in software supply chain security.

Security News
CAI is a new open source AI framework that automates penetration testing tasks like scanning and exploitation up to 3,600× faster than humans.

Security News
Deno 2.4 brings back bundling, improves dependency updates and telemetry, and makes the runtime more practical for real-world JavaScript projects.