Research
/Security News
Critical Vulnerability in NestJS Devtools: Localhost RCE via Sandbox Escape
A flawed sandbox in @nestjs/devtools-integration lets attackers run code on your machine via CSRF, leading to full Remote Code Execution (RCE).
A helper for ploting scatter plots and trajectory plots with plotly.
Krishnaswamy Lab, Yale University
The package can be directly installed via pip:
pip install plotly3d
def scatter(points, colors=None, **kwargs):
    """
    Plots 3D scatter plot with optional rescaling, coloring, and customization.

    Parameters:
    - points: Array of points to plot.
    - colors: Optional array of colors for each point.
    - scaler: Optional scaler object to rescale points. If None and rescaling is enabled, MinMaxScaler is used.
    - **kwargs: Additional optional arguments:
        - s (float): Size of the markers.
        - alpha (float): Opacity of the markers.
        - force_continuous (bool): Force treating colors as continuous even if they seem categorical.
        - title (str): Title of the plot.
        - filename (str): If provided, saves the plot to this file.
        - rescale (bool): If True, rescales points using the provided or default scaler.
        - fig (go.Figure): Plotly figure object to which the scatter plot will be added. If None, a new figure is created.
        - xtitle (str), ytitle (str), ztitle (str): Titles for the X, Y, and Z axes.

    Returns:
    - Plotly figure containing the scatter points plotted in 3D space.
    """
def trajectories(trajs, colors=None, **kwargs):
    """
    Plots trajectories in 3D space using Plotly, with unique colors for each category and a single legend entry per category.

    Parameters:
    - trajs: numpy array of shape (a, b, c), where
      a: time bins, b: trajectory index, c: space dimension (c=3 for 3D).

    Returns:
    - Plotly figure containing the trajectories plotted in 3D space.
    """
FAQs
A helper for ploting scatter plots and trajectory plots with plotly
We found that plotly3d demonstrated a healthy version release cadence and project activity because the last version was released less than a year ago. It has 1 open source maintainer collaborating on the project.
Did you know?

Socket for GitHub automatically highlights issues in each pull request and monitors the health of all your open source dependencies. Discover the contents of your packages and block harmful activity before you install or update your dependencies.

Research
/Security News
A flawed sandbox in @nestjs/devtools-integration lets attackers run code on your machine via CSRF, leading to full Remote Code Execution (RCE).

Product
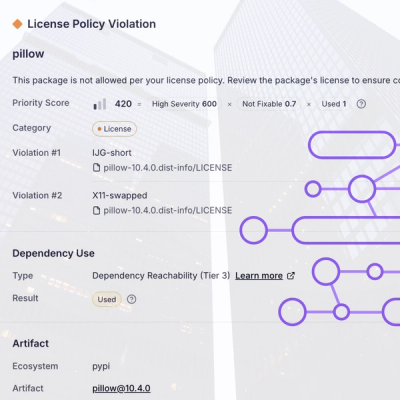
Customize license detection with Socket’s new license overlays: gain control, reduce noise, and handle edge cases with precision.

Product
Socket now supports Rust and Cargo, offering package search for all users and experimental SBOM generation for enterprise projects.