Research
/Security News
Critical Vulnerability in NestJS Devtools: Localhost RCE via Sandbox Escape
A flawed sandbox in @nestjs/devtools-integration lets attackers run code on your machine via CSRF, leading to full Remote Code Execution (RCE).
This profiler is sponsored by my book on writing fast low-level code in Python, which uses Numba for most of its examples.
Here's what Profila output looks like:
$ python -m profila annotate -- scripts_for_tests/simple.py
# Total samples: 328 (54.9% non-Numba samples, 1.8% bad samples)
## File `/home/itamarst/devel/profila/scripts_for_tests/simple.py`
Lines 10 to 15:
0.3% | for i in range(len(timeseries)):
| # This should be the most expensive line:
38.7% | result[i] = (7 + timeseries[i] / 9 + (timeseries[i] ** 2) / 7) / 5
| for i in range(len(result)):
| # This should be cheaper:
4.3% | result[i] -= 1
You can also use it with Jupyter!
Beyond this README, you can also read this introductory article with a more detailed example and explanations.
TL;DR limitations: Linux only, and only single-threaded Numba can be profiled currently, parallel functions are not yet supported.
Currently Profila works on Linux only.
Install this library using pip:
pip install profila
Then, have Profila install some dependencies it needs, specifically an older version of gdb; this will not interfere with your system gdb. (This is necessary due to some bad interactions with newer gdb and Numba that will hopefully go away someday.)
python -m profila setup
First, before you import numba you should:
%load_ext profila
Then define your functions as usual:
from numba import njit

@njit
def myfunc(arr):
    # ... your code here ...
You probably want to call your Numba function at least once, so profiling doesn't measure compilation time:
myfunc(DATA)
Then, you can profile a specific cell using the %%profila magic, e.g.
%%profila
# Make sure we run this enough to get good measurements:
for i in range(100):
    myfunc(DATA)
If you usually run your script like this:
$ python yourscript.py --arg1=200
Instead run it like this:
$ python -m profila annotate -- yourscript.py --arg1=200
If you usually run your script like this, with -m:
$ python -m yourpackage --arg1=200
Instead run it like this:
$ python -m profila annotate -- -m yourpackage --arg1=200
Sampling is done every 10 milliseconds, so you need to make sure your Numba code runs for a sufficiently long time. For example, you can run your function in a loop until a number of seconds has passed:
from time import time

@njit
def myfunc():
    # ...

start = time()
# Run for 3 seconds:
while (time() - start) < 3:
    myfunc()
Beyond that:
Compiled languages like Numba do optimization passes and transform the code to make it faster. That means the running code doesn't necessarily map one to one to the original code; different lines might be combined, for example.
As far as I can tell Numba does give you a reasonable mapping, but you can't assume the source code maps one to one to executed code.
In order to profile, additional info needs to be added during compilation; specifically, the NUMBA_DEBUGINFO env variable is set.
This might change runtime characteristics slightly, because it increases the memory size of the compiled code.
Instruction-level parallelism, branch mispredictions, SIMD, and the CPU memory caches all have a significant impact on runtime performance, but they don't show up in profiling. I'm writing a book about this if you want to learn more.
python -m profila setup should now work correctly in Conda environments.Documentation improvements.
Bug fixes:
TypeError: argument of type 'NoneType' is not iterable.Bug fixes:
sys.executable, so it works in more environments.
Thanks to Jeremiah England for the bug report.Added support for Jupyter profiling.
Initial release.
FAQs
A profiler for Numba
We found that profila demonstrated a healthy version release cadence and project activity because the last version was released less than a year ago. It has 1 open source maintainer collaborating on the project.
Did you know?

Socket for GitHub automatically highlights issues in each pull request and monitors the health of all your open source dependencies. Discover the contents of your packages and block harmful activity before you install or update your dependencies.

Research
/Security News
A flawed sandbox in @nestjs/devtools-integration lets attackers run code on your machine via CSRF, leading to full Remote Code Execution (RCE).

Product
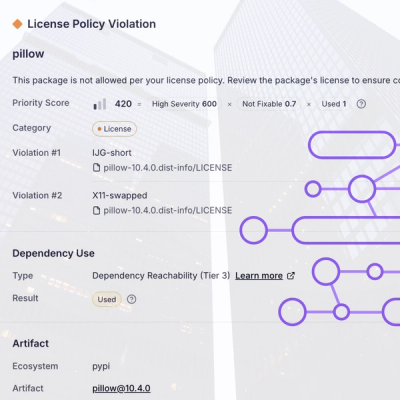
Customize license detection with Socket’s new license overlays: gain control, reduce noise, and handle edge cases with precision.

Product
Socket now supports Rust and Cargo, offering package search for all users and experimental SBOM generation for enterprise projects.