Sometimes you need sophisticated line-by-line profiling for optimizing your Python code. Other times, you just want a quick and basic memory profile chart.
There are plenty of tools for the former use-case, e.g. py-spy or vprof. But not many (or any) tools for the latter use-case.
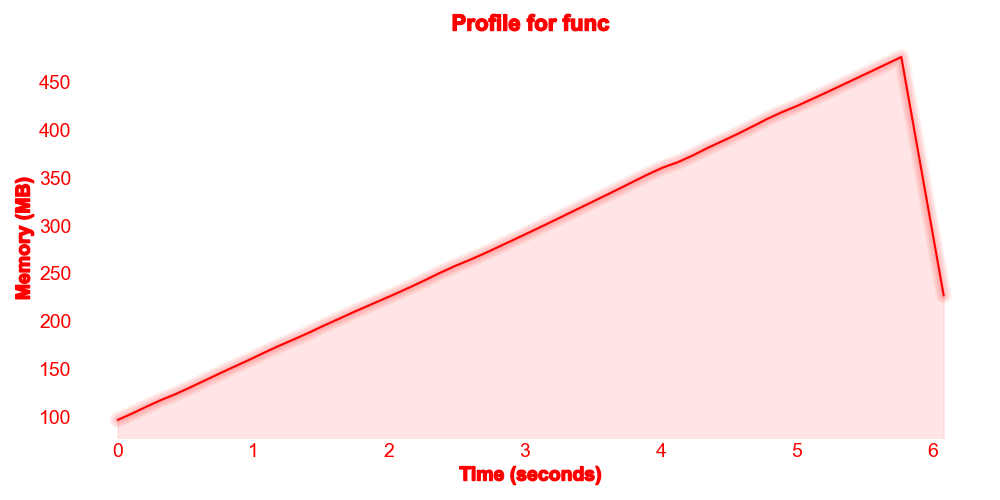
profile-this is a stupid simple memory profiler for people who just want a basic memory profiling plot without writing one from scratch.
Links
Source Code
PyPI
Example
Install it like this:
pip install profile-this
Do this:
from random import randint
from profile_this import ProfileThis

def func(n=10_000_000):
    return sum([randint(0, i + 1) for i in range(n)])

profiler = ProfileThis()
profiler.start()
func()
profiler.stop()
profiler.plot(
    title="Profile for func", path="docs/func.png"
)
Or this:
with ProfileThis() as profiler:
    func()

profiler.plot(
    title="Profile for func",
    path="docs/func.png",
)
Or this:
from profile_this import profilethis

@profilethis(title="Profile for func", path="docs/func.png")
def func(n=10_000_000):
    return sum([randint(0, i + 1) for i in range(n)])

func()
To get this: