

Security News
Another Round of TEA Protocol Spam Floods npm, But It’s Not a Worm
Recent coverage mislabels the latest TEA protocol spam as a worm. Here’s what’s actually happening.
By Philipp Burckhardt - Nov 14, 2025
![]()
![]()
![]()
![]()
![]()
pynsee gives a quick access to more than 150 000 macroeconomic series,
a dozen datasets of local data, numerous sources available on insee.fr,
geographical limits of administrative areas taken from IGN
as well as key metadata and SIRENE database containing data on all French companies.
Have a look at the detailed API page portail-api.insee.fr.
This package is a contribution to reproducible research and public data transparency. It benefits from the developments made by teams working on APIs at INSEE and IGN.
Credentials are necessary to access SIRENE API available through pynsee by the module sirene. API credentials can be created here : portail-api.insee.fr. All other modules are freely accessible.
# Download Pypi package
pip install pynsee[full]

# Get the development version from GitHub
# git clone https://github.com/InseeFrLab/pynsee.git
# cd pynsee
# pip install .[full]

# Subscribe to portail-api.insee.fr and get your credentials!
# Save your credentials with init_conn function :
from pynsee.utils import init_conn
init_conn(sirene_key="my_sirene_key")

# Beware : any change to the keys should be tested after having cleared the cache
# Please do : from pynsee.utils import clear_all_cache; clear_all_cache()
get_dataset_list to search what are your datasets of interest and then get the series list with get_series_list.
Alternatively, you can make a keyword-based search with search_macrodata, e.g. search_macrodata('GDP').
Then, get the data with get_dataset or get_seriesget_local_metadata, then get data with get_local_dataget_activity_listget_dimension_list, then use search_sirene with dimensions as filtering variablesget_geodata_list and then retrieve it with get_geodataget_file_list and then download it with download_fileFor further advice, have a look at the documentation and gallery of the examples.
import math
import matplotlib.cm as cm
import matplotlib.pyplot as plt
import numpy as np
import pandas as pd
from pynsee.geodata import get_geodata_list, get_geodata
# get geographical data list
geodata_list = get_geodata_list()
# get departments geographical limits
mapcom = get_geodata("ADMINEXPRESS-COG-CARTO.LATEST:commune").to_crs(epsg=3035)
# area calculations depend on crs which fits metropolitan france but not overseas departements
# figures should not be considered as official statistics
mapcom.attrs["area"] = mapcom.area / 10**6
mapcom = mapcom.to_crs(epsg=3857)
mapcom['REF_AREA'] = 'D' + mapcom['code_insee']
mapcom['density'] = mapcom['population'] / mapcom.attrs["area"]
mapcom = mapcom.transform_overseas(departement=['971', '972', '974', '973', '976', 'NR'],
factor=[1.5, 1.5, 1.5, 0.35, 1.5, 1.5])
mapcom = mapcom.zoom(
departement=["75","92", "93", "91", "77", "78", "95", "94"],
factor=1.5, startAngle = math.pi * (1 - 3.5 * 1/9))
density_ranges = [
40, 80, 100, 120, 150, 200, 250, 400, 600, 1000, 2000, 5000, 10000, 20000
]
rvals = np.full(len(mapcom), "< 40", dtype=object)
list_ranges = ["< 40"]
for rmin, rmax in zip(density_ranges, density_ranges[1:]):
range_string = f"[{rmin}, {rmax}["
list_ranges.append(range_string)
rvals[(mapcom.density >= rmin) & (mapcom.density < rmax)] = range_string
rvals[mapcom.density.values > density_ranges[-1]] = "> 20 000"
list_ranges.append("> 20 000")
mapcom.loc[:, "range"] = pd.Categorical(rvals, ordered=True, categories=list_ranges)
fig, ax = plt.subplots(1, 1, figsize=(15, 15))
lgd = {'bbox_to_anchor': (1.1, 0.8), 'title': 'density per km2'}
mapcom.plot(column="range", cmap=cm.viridis, legend=True, ax=ax, legend_kwds=lgd)
ax.set_axis_off()
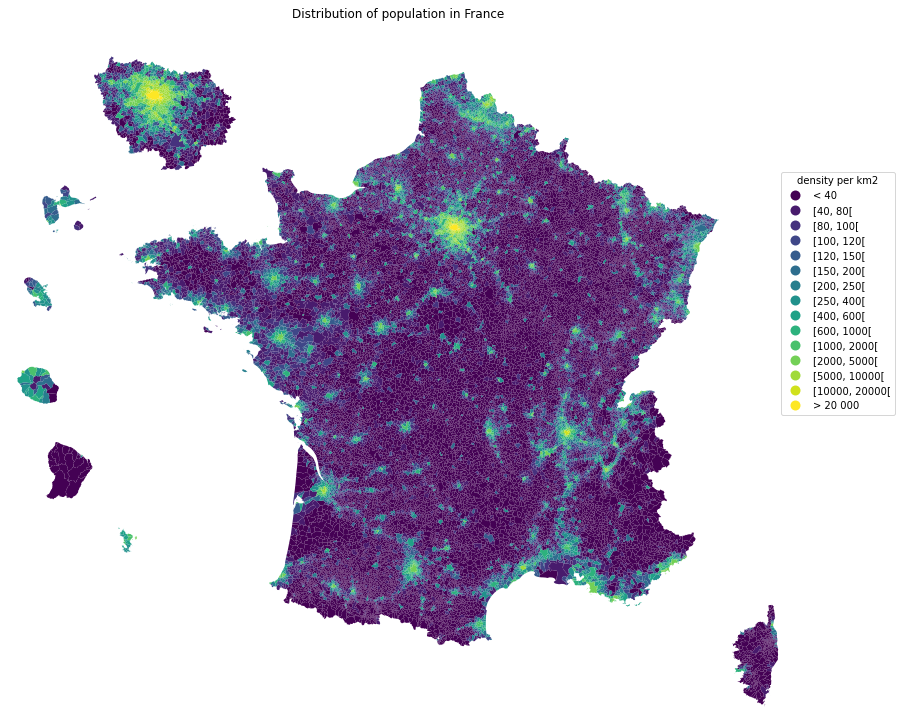
ax.set(title='Distribution of population in France')
plt.show()
fig.savefig('pop_france.svg',
format='svg', dpi=1200,
bbox_inches = 'tight',
pad_inches = 0)
# Use the proxy_server argument of the init_conn function to change the proxy server address
from pynsee.utils import init_conn
init_conn(sirene_key="my_sirene_key",
          http_proxy="http://my_proxy_server:port",
          https_proxy="http://my_proxy_server:port")

# Beware : any change to the keys should be tested after having cleared the cache
# Please do : from pynsee.utils import *; clear_all_cache()

# Alternativety you can use directly environment variables as follows.
# Beware not to commit your credentials!
import os
os.environ['sirene_key'] = 'my_sirene_key'
os.environ['http_proxy'] = "http://my_proxy_server:port"
os.environ['https_proxy'] = "http://my_proxy_server:port"
Feel free to open an issue with any question about this package using the Github repository.
All contributions, whatever their forms, are welcome. See CONTRIBUTING.md
FAQs
Tools to Easily Search and Download French Data From INSEE and IGN APIs.
We found that pynsee demonstrated a healthy version release cadence and project activity because the last version was released less than a year ago. It has 2 open source maintainers collaborating on the project.
Did you know?

Socket for GitHub automatically highlights issues in each pull request and monitors the health of all your open source dependencies. Discover the contents of your packages and block harmful activity before you install or update your dependencies.
Security News
Recent coverage mislabels the latest TEA protocol spam as a worm. Here’s what’s actually happening.

Security News
PyPI adds Trusted Publishing support for GitLab Self-Managed as adoption reaches 25% of uploads

Research
/Security News
A malicious Chrome extension posing as an Ethereum wallet steals seed phrases by encoding them into Sui transactions, enabling full wallet takeover.