
Research
PyPI Package Impersonates SymPy to Deliver Cryptomining Malware
Malicious PyPI package sympy-dev targets SymPy users, a Python symbolic math library with 85 million monthly downloads.
By Kirill Boychenko - Jan 21, 2026
reixs
Advanced tools
Library to analyse, plot, and export data taken at the REIXS Beamline at the Canadian Light Source, Saskatoon, Canada.
This is a library to analyse, plot, and export REIXS beamline data. The package is meant to provide a framework to load data into jupyter and enable data interaction.
Further beamline information is available on the Website of the Canadian Light Source.
Install the package from PyPi with the pip package manager. This is the recommended way to obtain a copy for your local machine and will install all required dependencies.
$ pip install reixs
You will also need Jupyter Notebook together with python 3 on your local machine.
In case that certain widgets aren't rendered properly, make sure to enable the appropriate jupyter extensions
$ jupyter nbextension enable --py widgetsnbextension
Launch your local jupyter installation with
$ jupyter notebook
Before you start, you will need to import the required reixs package, enable bokeh plotting, and set the base directory.
## Define base directory
basedir = "/home/braun/ownCloud/Beamtime/example_data/"

## Setup necessarry inputs
from reixs.LoadData import *
from bokeh.io import show, output_notebook
output_notebook(hide_banner=True)
sca = Load1d()
sca.load(basedir,'FileName.dat','x_stream','y_stream',1,2,3,4)  # Loads multiple scans individually
sca.add(basedir,'FileName.dat','x_stream','y_stream',1,2,3,4)  # Adds multiple scans
sca.subtract(basedir,'FileName.dat','x_stream','y_stream',1,2,3,4,norm=False) # Subtracts scans from the first scan
sca.xlim(lower_lim,upper_lim) # Sets the horizontal axis plot region
sca.ylim(lower_lim,upper_lim) # Sets the vertical axis plot region
sca.plot_legend("pos string as per bokeh") # Determines a specific legend position
sca.vline(position) # Draws a vertical line
sca.hline(position) # Draws a horizontal line
sca.label(pos_x,pos_y,'Text') # Adds a label to the plot
sca.plot() # Plots the defined object
sca.exporter() # Exports the data by calling an exporter widget
Create "Loader" object
Specify the variable for the base directory (basedir)
Enter the file name of the scan to analyse ('FileName.dat')
Options for x_stream quantities include:
List all scans to analyse (comma-separated)
Set optional flags. Options include:
xas = XASLoader()
xas.load(basedir,'Plate2a.dat','TEY',1,4,6)
xas.load(basedir,'Plate2a.dat','PFY[O]',1,4)
xas.add(basedir,'Plate2a.dat','PFY[500:520]',1,4)
xas.subtract(basedir,'Plate2a.dat','specPFY[500:520]',1,4,6)
xas.plot()
xas.exporter()
xes = XESLoader()
# Options: XES, rXES
xes.load(basedir,'Plate2a.dat','XES',3,xoffset=[(515,520),(520,525),(530,535)])
xes.load(basedir,'Plate2a.dat','rXES[520:560]',4)
xes.add(basedir,'Plate2a.dat','XES',1,4)
xes.subtract(basedir,'Plate2a.dat','XES',1,4)
xes.plot()
xes.exporter()
xrf = XRFLoader()
# Options XRF,rXRF
xrf.load(basedir,'Plate2a.dat','XRF',3)
xrf.load(basedir,'Plate2a.dat','rXRF[520:560]',4)
xrf.add(basedir,'Plate2a.dat','XRF',1,4,)
xrf.subtract(basedir,'Plate2a.dat','XRF',1,4)
xrf.plot()
xrf.exporter()
xeol = XEOLLoader()
#Options: XEOL, rXEOL
xeol.load(basedir,'RIXS_ES_QA.dat','XEOL',1,2,3,4,background=3)
xeol.load(basedir,'RIXS_ES_QA.dat','XEOL',1,2,3,4,background=True)
xeol.plot()
Note: Can only load one scan at a time!
load2d = Load2d()
load2d.load(basedir,'Filename.dat','x_stream','y_stream','detector',1)
load2d.plot()
load2d.exporter()
Create "Loader" object
Specify the variable for the base directory (basedir)
Enter the file name of the scan to analyse ('FileName.dat')
Options for x_stream quantities include:
List all scans to analyse (comma-separated)
Set optional flags. Options include:
Note: Can only load one scan at a time!
eems = EEMsLoader()
eems.load(basedir,'Plate2a.dat','SDD',1)
eems.load(basedir,'Plate2a.dat','MCP',1)
eems.load(basedir,'RIXS_ES_QA.dat','XEOL',2,background=3)
eems.plot()
eems.exporter()
mesh = LoadMesh()
mesh.load(basedir,'Filename.txt','x_stream','y_stream','z_stream',24)
mesh.plot()
mesh.exporter()
Create "Loader" object
Specify the variable for the base directory (basedir)
Enter the file name of the scan to analyse ('FileName.dat')
Options for x_stream quantities include:
List all scans to analyse (comma-separated)
Set optional flags. Options include:
FAQs
Library to analyse, plot, and export data taken at the REIXS Beamline at the Canadian Light Source, Saskatoon, Canada.
We found that reixs demonstrated a healthy version release cadence and project activity because the last version was released less than a year ago. It has 1 open source maintainer collaborating on the project.
Did you know?

Socket for GitHub automatically highlights issues in each pull request and monitors the health of all your open source dependencies. Discover the contents of your packages and block harmful activity before you install or update your dependencies.
Research
Malicious PyPI package sympy-dev targets SymPy users, a Python symbolic math library with 85 million monthly downloads.
Product
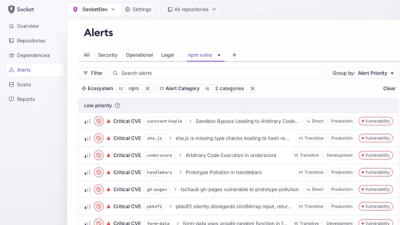
Create and share saved alert views with custom tabs on the org alerts page, making it easier for teams to return to consistent, named filter sets.

Product
Socket’s Rust and Cargo support is now generally available, providing dependency analysis and supply chain visibility for Rust projects.